Economy and budget context
Economy and Cost of Living - Context
UK CPI inflation measured 3.9% in the 12 months to November 2023, continuing its downward trend and down from 4.6% in October. As evidenced within Consumer price inflation, UK - Office for National Statistics, high Inflation has been a key feature of the UK economy over the past 24 months, peaking at 11.1% in October 2022, the highest rate in over 40 years. Whilst inflation is now around twice the official Bank of England target of 2%, the period of sustained price rises continues to impact on the people of Scotland.
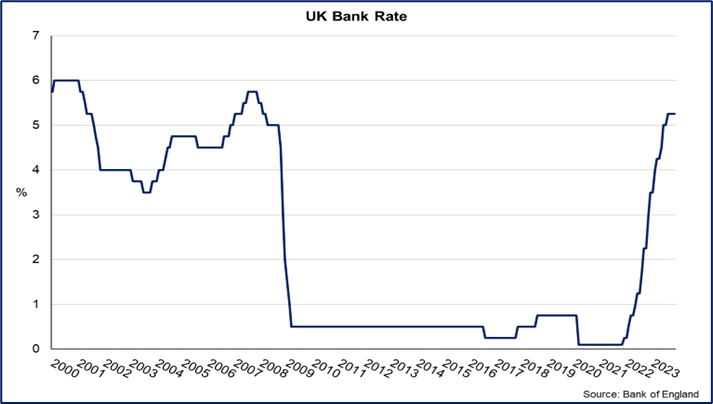
In response to inflation and wider economic data, the Bank of England have gradually raised Bank Rates, which although now held constant, at 5.25%, reflects a series of rises that began since December 2021 when the rate was 0.1%. The Bank Rate remains at its highest level since 2008 and is expected to remain at restrictive rates to support the fall in inflation back towards the 2% target in the medium term.
The below graph shows the changing UK Bank of England rates between the years 2000 and 2023. Source - Monetary policy, Bank of England.
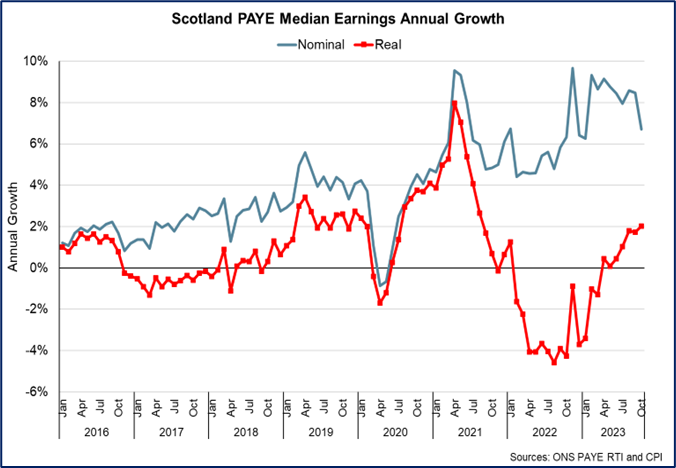
In terms of earnings, PAYE median monthly nominal pay grew 6.7% over the year in October, slightly slower than in recent months, and grew by 2% in real terms once adjusted for inflation. This is the strongest real terms growth since August 2021. But earnings fell in real terms over the course of 2022 and much of 2023.
The economic outlook remains challenging. The Scottish Fiscal Commission latest forecast is for Scotland’s economy to grow 0.2% in 2023, rising to 0.8% in 2024. Scotlands-Economic-and-Fiscal-Forecasts-December-2023-Summary.pdf
The latest OBR Economic and Fiscal Outlook https://obr.uk/economic-and-fiscal-outlooks/ notes that the UK economy recovered its pre-pandemic level at the end of 2021 and was 1.8 per cent above it in mid-2023. One major factor driving growth was high levels of net migration, with Real GDP per person remaining 0.6 per cent below its pre-pandemic peak and in the OBR’s central forecast it only recovers that peak at the start of 2025.
Despite the UK Government's Energy Price Guarantee, energy prices have risen dramatically since 2020 and are forecast to remain high in future years: Scottish Government modelling estimates that there are around 860,000 (35%) fuel-poor households in Scotland, of which 600,000 (24%) will be in extreme fuel poverty.
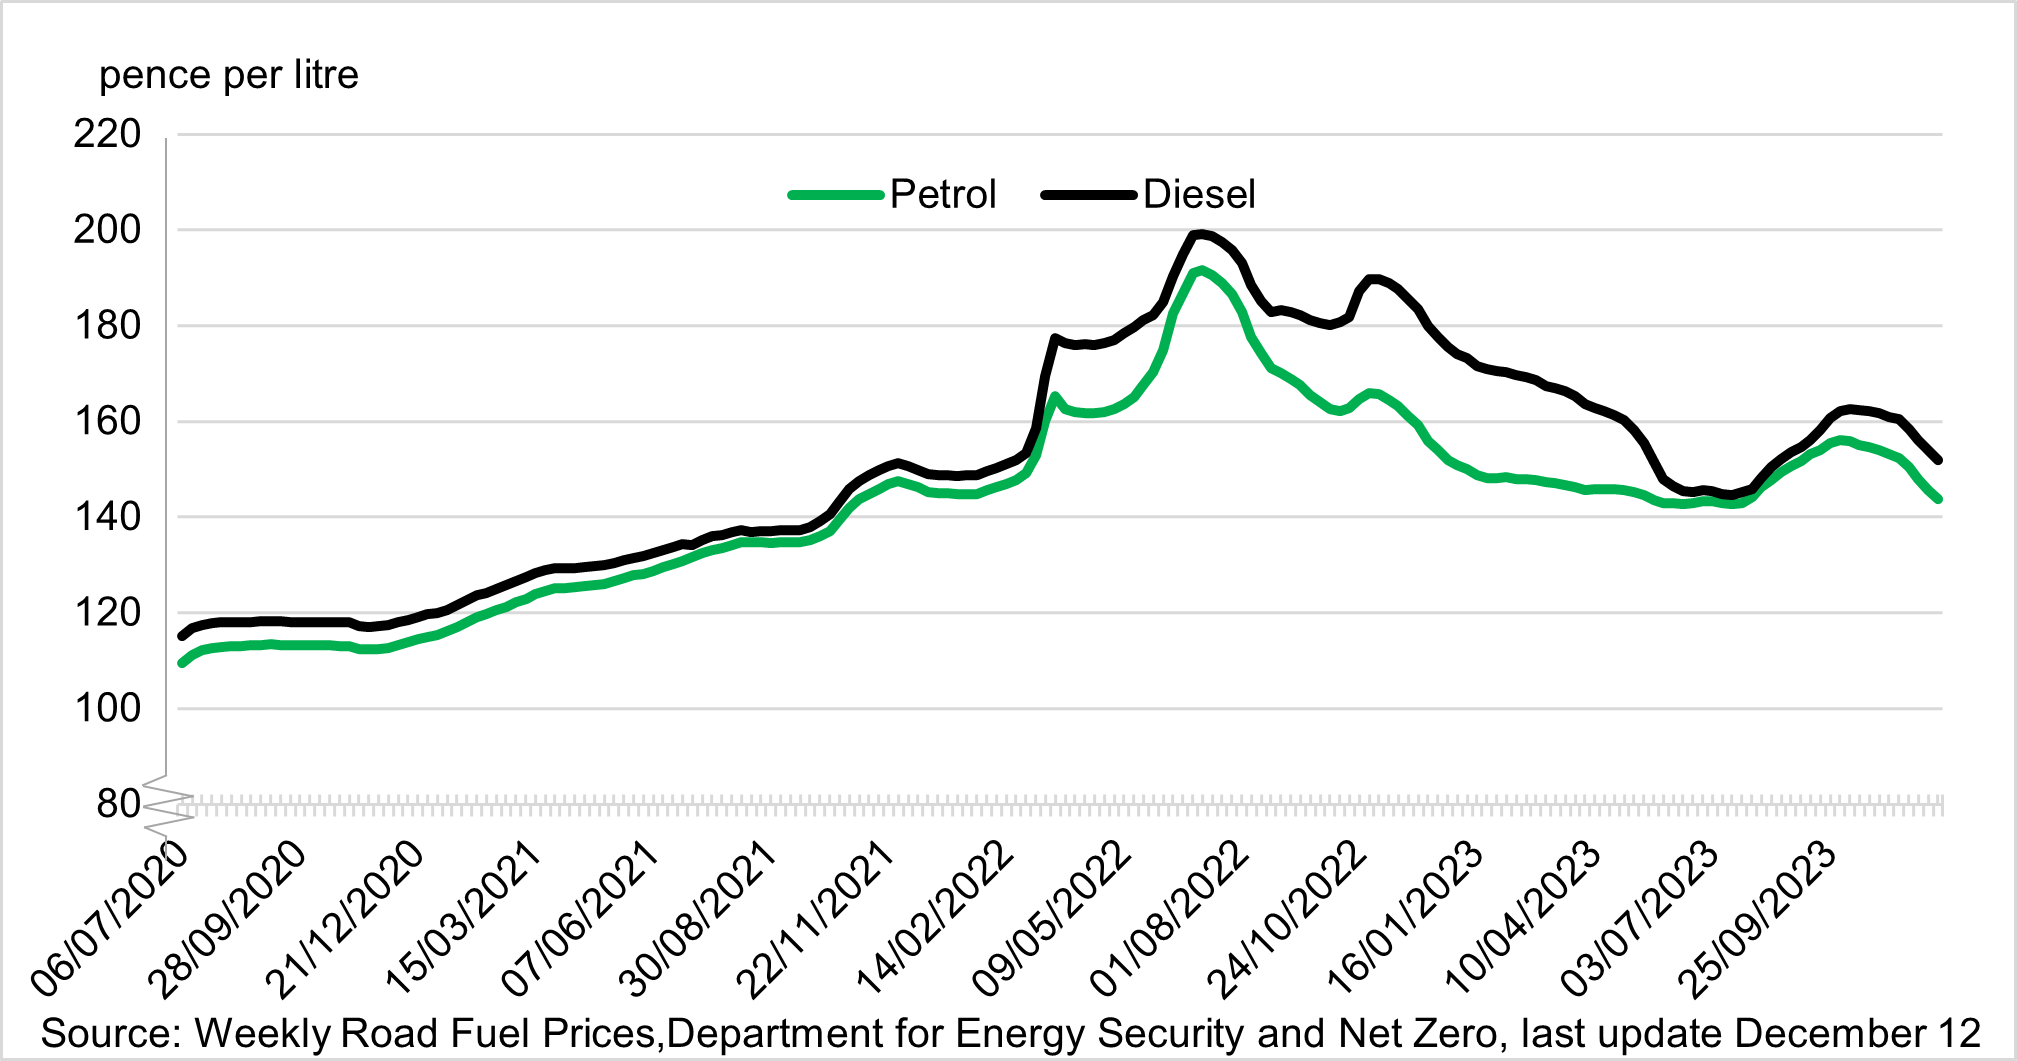
The cost of motoring has also rapidly increased particularly through the rising cost of petrol & diesel, as seen in Figure 3 albeit both Petrol and Diesel prices are now lower than in Summer 2022.
These factors combined have resulted in the greatest fall in living standards (as measured by the real value of disposable income per person) since records began in the 1950s. Even with a forecast of inflation returning to lower levels, the OBR do not forecast that real disposable income per person will recover to its 2021-22 level until 2027-28.
Economy and Cost of Living – Forward Look
At both a UK and Scottish level, fiscal forecasters predict that economy is predicted to recover slowly. For example, at a UK level, the OBR’s central forecast only sees GDP per capita recover to its pre-pandemic peak at the start of 2025 while real disposable income per person will not return to its 2021-22 level until 2027-28.
In Scotland, due to strong earnings growth, SFC have revised up their forecasts of real disposable income per person. Despite this, the drop between 2021-22 and 2023-24 is the largest reduction in living standards since Scottish records began in 1998. See Figure 4.
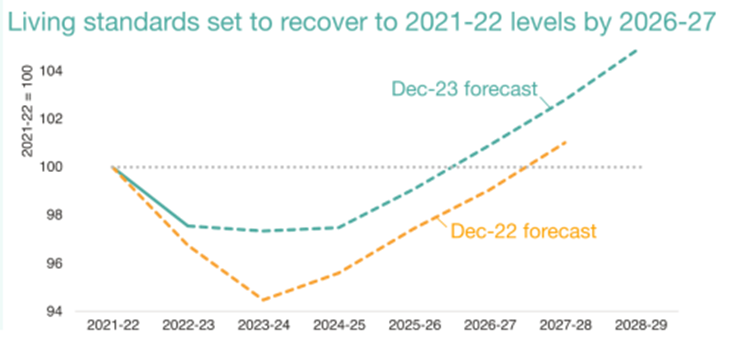
Source – Scotland’s Economic and Fiscal Forecasts – December 2023 – Scottish Fiscal Commission
While on average they forecast living standards to remain broadly flat in 2024-25, the outlook will vary across different household types. There are particular pressures on lower-income households, as they spend a larger share of income on essentials such as energy, food, and housing costs.
Lower-income households and some mortgage holders are likely to see a further fall in their living standards in 2024-25, while higher-income households who tend to have larger savings are likely to see a boost to their living standards from rising savings income.
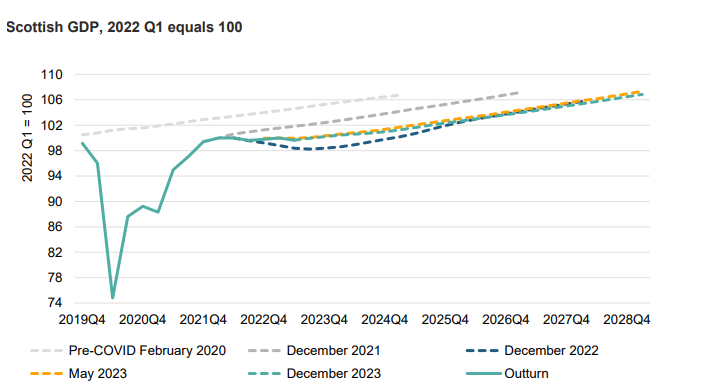
The weak outlook for GDP in the near term prolongs a period of economic stagnation over the last two years. Following recent upward data revisions, Scottish GDP is now estimated to have returned to its pre-COVID 2019 Q4 level in 2021 Q4, but growth has largely been flat since then with some volatility from quarter to quarter.
Although SFC no longer have a technical recession (2 consecutive quarters of falling GDP) as part of their central forecast, the overall environment remains one of slow and fragile economic growth in the near term.
Budget Constraints – Context
Context: Historic Trends in Transport Expenditure
Government Expenditure and Revenue Scotland is a useful lens for looking at how the overall volume of transport expenditure in Scotland has changed over the longer term. The most recent publication covers the period 1998-99 to 2022-23. Over this period, Transport expenditure has increased in both cash terms, real terms and as a percentage of total public sector expenditure in Scotland. However, the narrative depends on the time period that is analysed.
Figure 6, below looks at cash terms expenditure over time. Broadly speaking there is a growth in both current and capital spending. Early in the time series capital spend grew faster than current spend. From 2005-06 there is a similar trend in both spend types up to the point of the pandemic. Over this period Current expenditure rises from £926 million in 2005-06 to £1,836 million in 2019-20 (an increase of 98%), while capital expenditure rises from £913 million in 2005-06 to £1,879 million (an increase of 106%). Over the pandemic capital expenditure continued to rise, while current expenditure spiked in 2020-21 and has fallen back since – this is driven in part by the need to respond to a drop in revenue generated by public transport while coronavirus restrictions were in place.
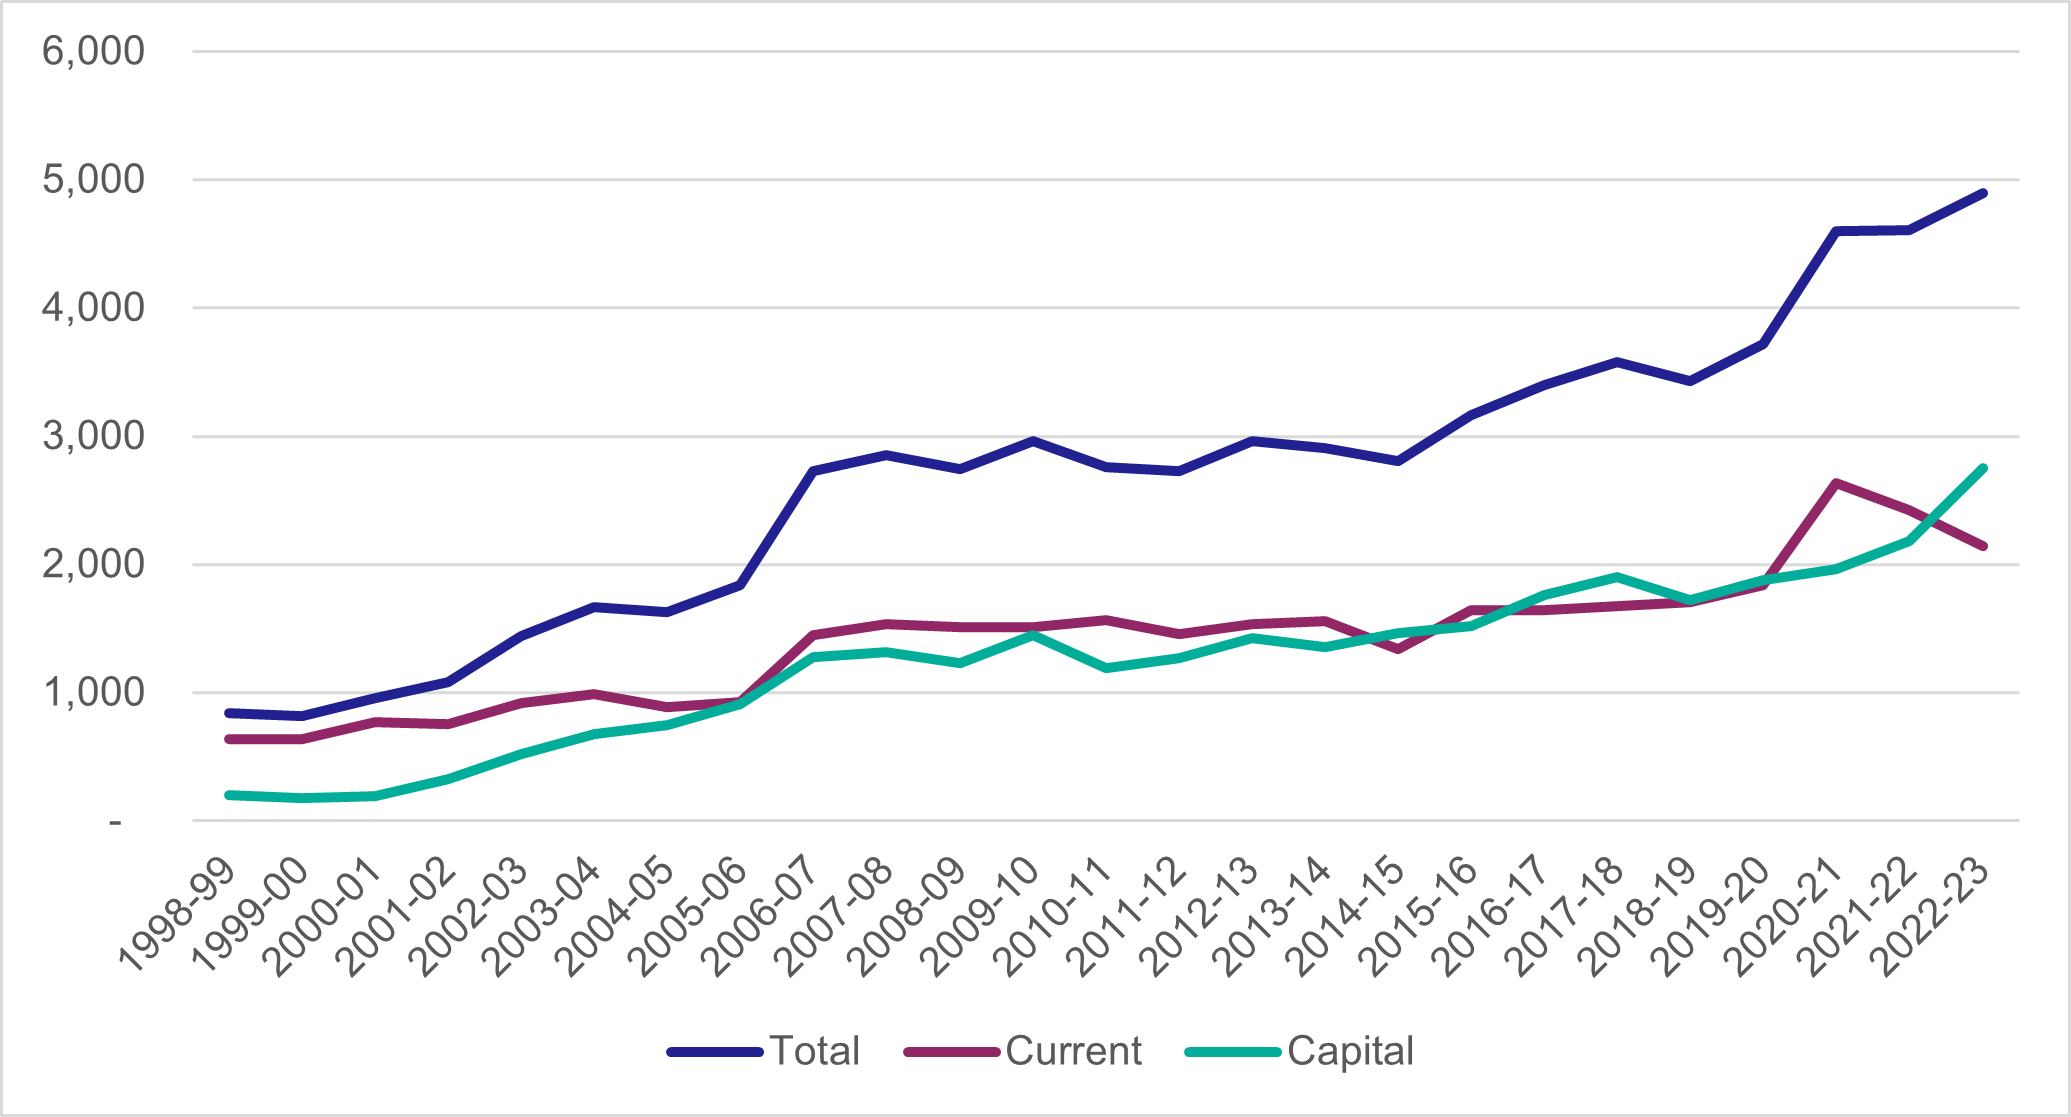
While Figure 6 does not account for inflation and budgetary pressures, Figure 7 and Figure 8 do and present more nuance, and set out more of the context in which transport budgets have been set.
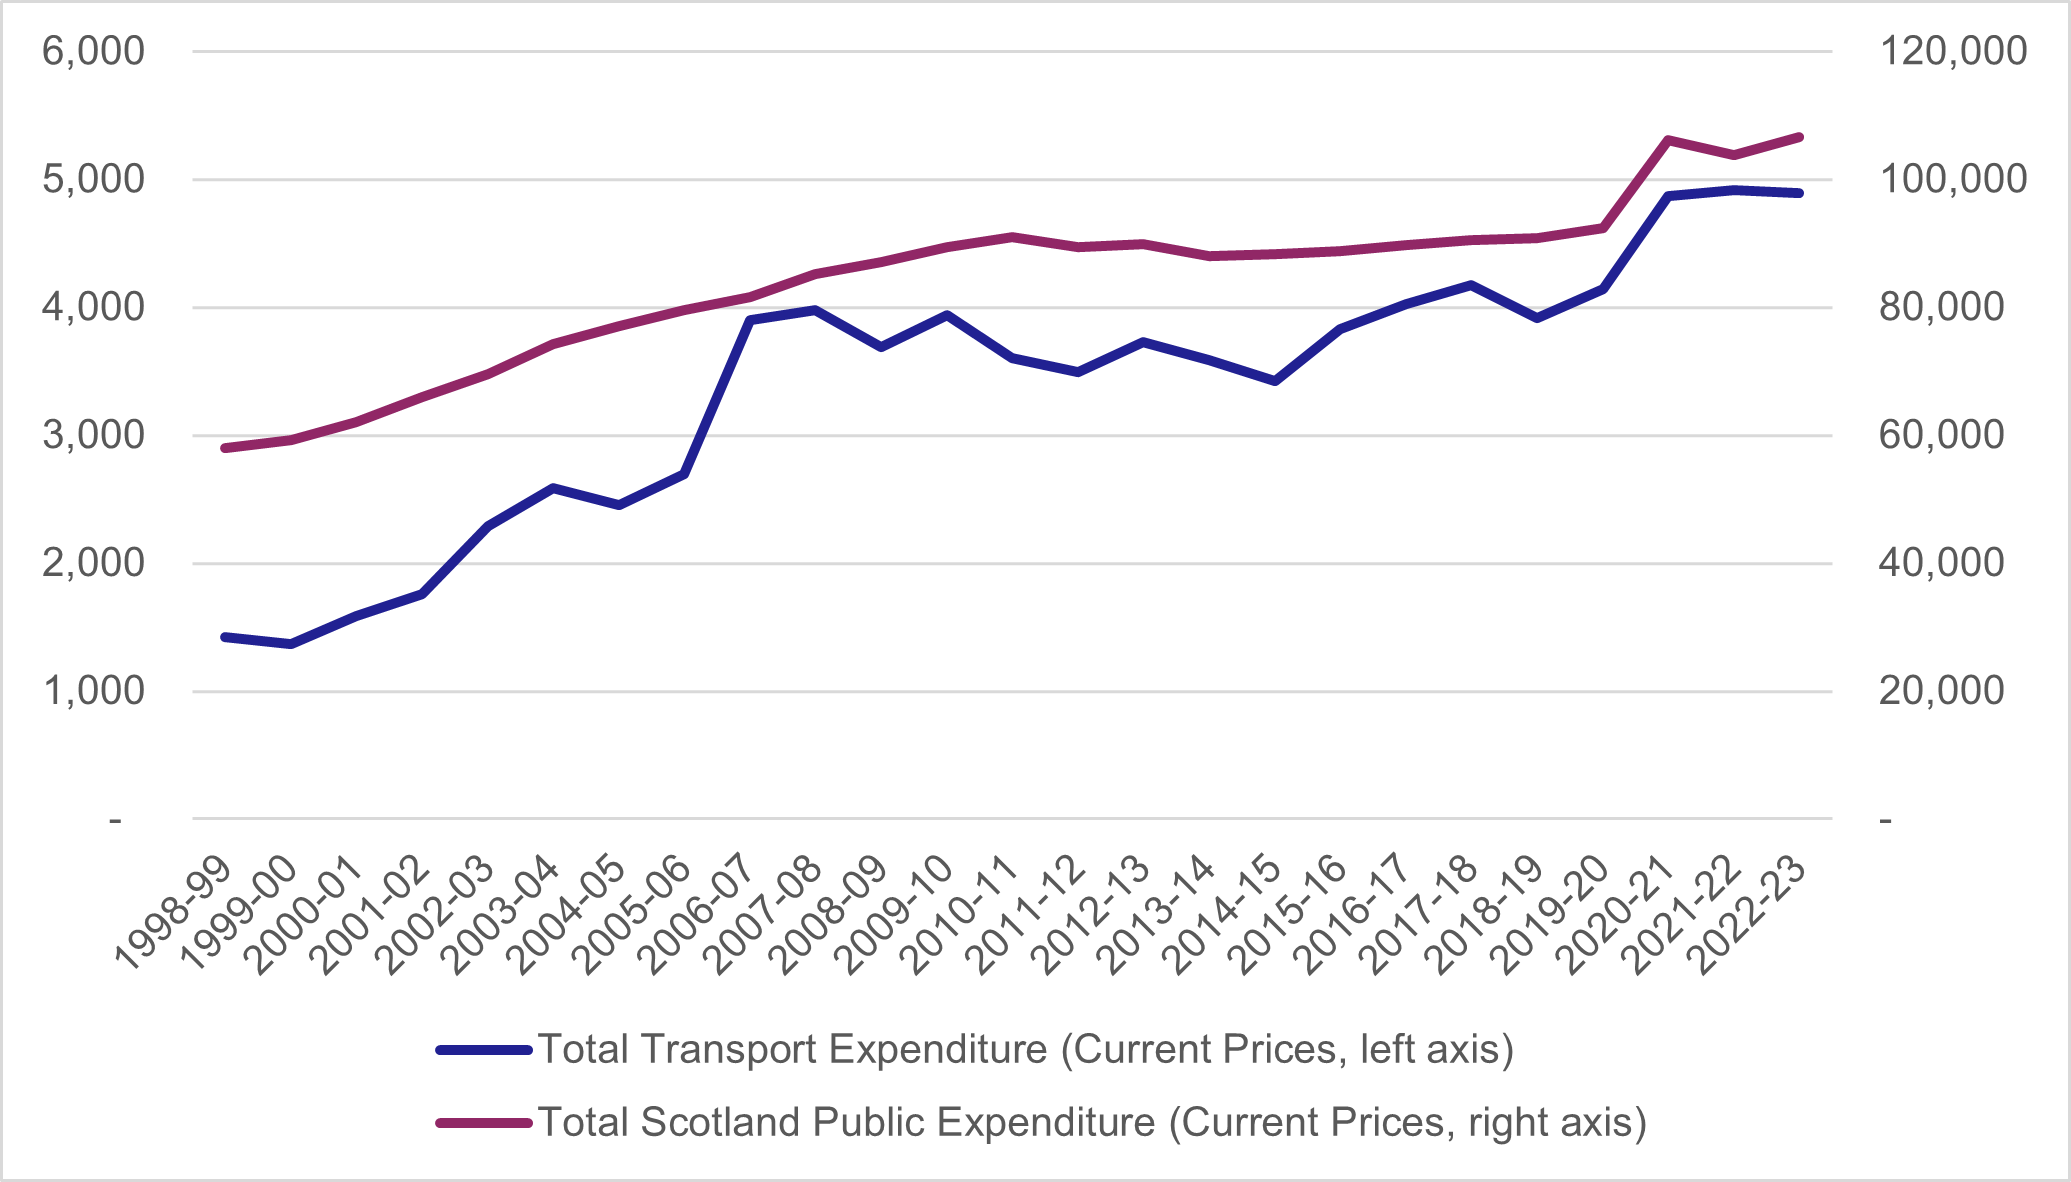
Figure 7 shows the real terms growth in both the total public expenditure in Scotland (on the right axis) and total transport expenditure (on the left axis). Here we can see that trends and overall rises have been similar since the mid-2000s.
Finally, Figure 8 shows the % of total public expenditure accounted for by transport, split by type of expenditure. Here we see that total expenditure remains at a relatively stable level since the mid-2000s. In each year from 2006-07 to 2022-23, Transport has accounted for between 3.9% and 4.8% of total expenditure in Scotland. However, this masks a significant growth in the proportion of capital expenditure accounted for by transport, given the relatively small role of capital in terms of overall spend. By the late 2010s, transport capital expenditure has grown to take up around 20% of capital expenditure in Scotland, and this rises to almost 24% in 2022-23.
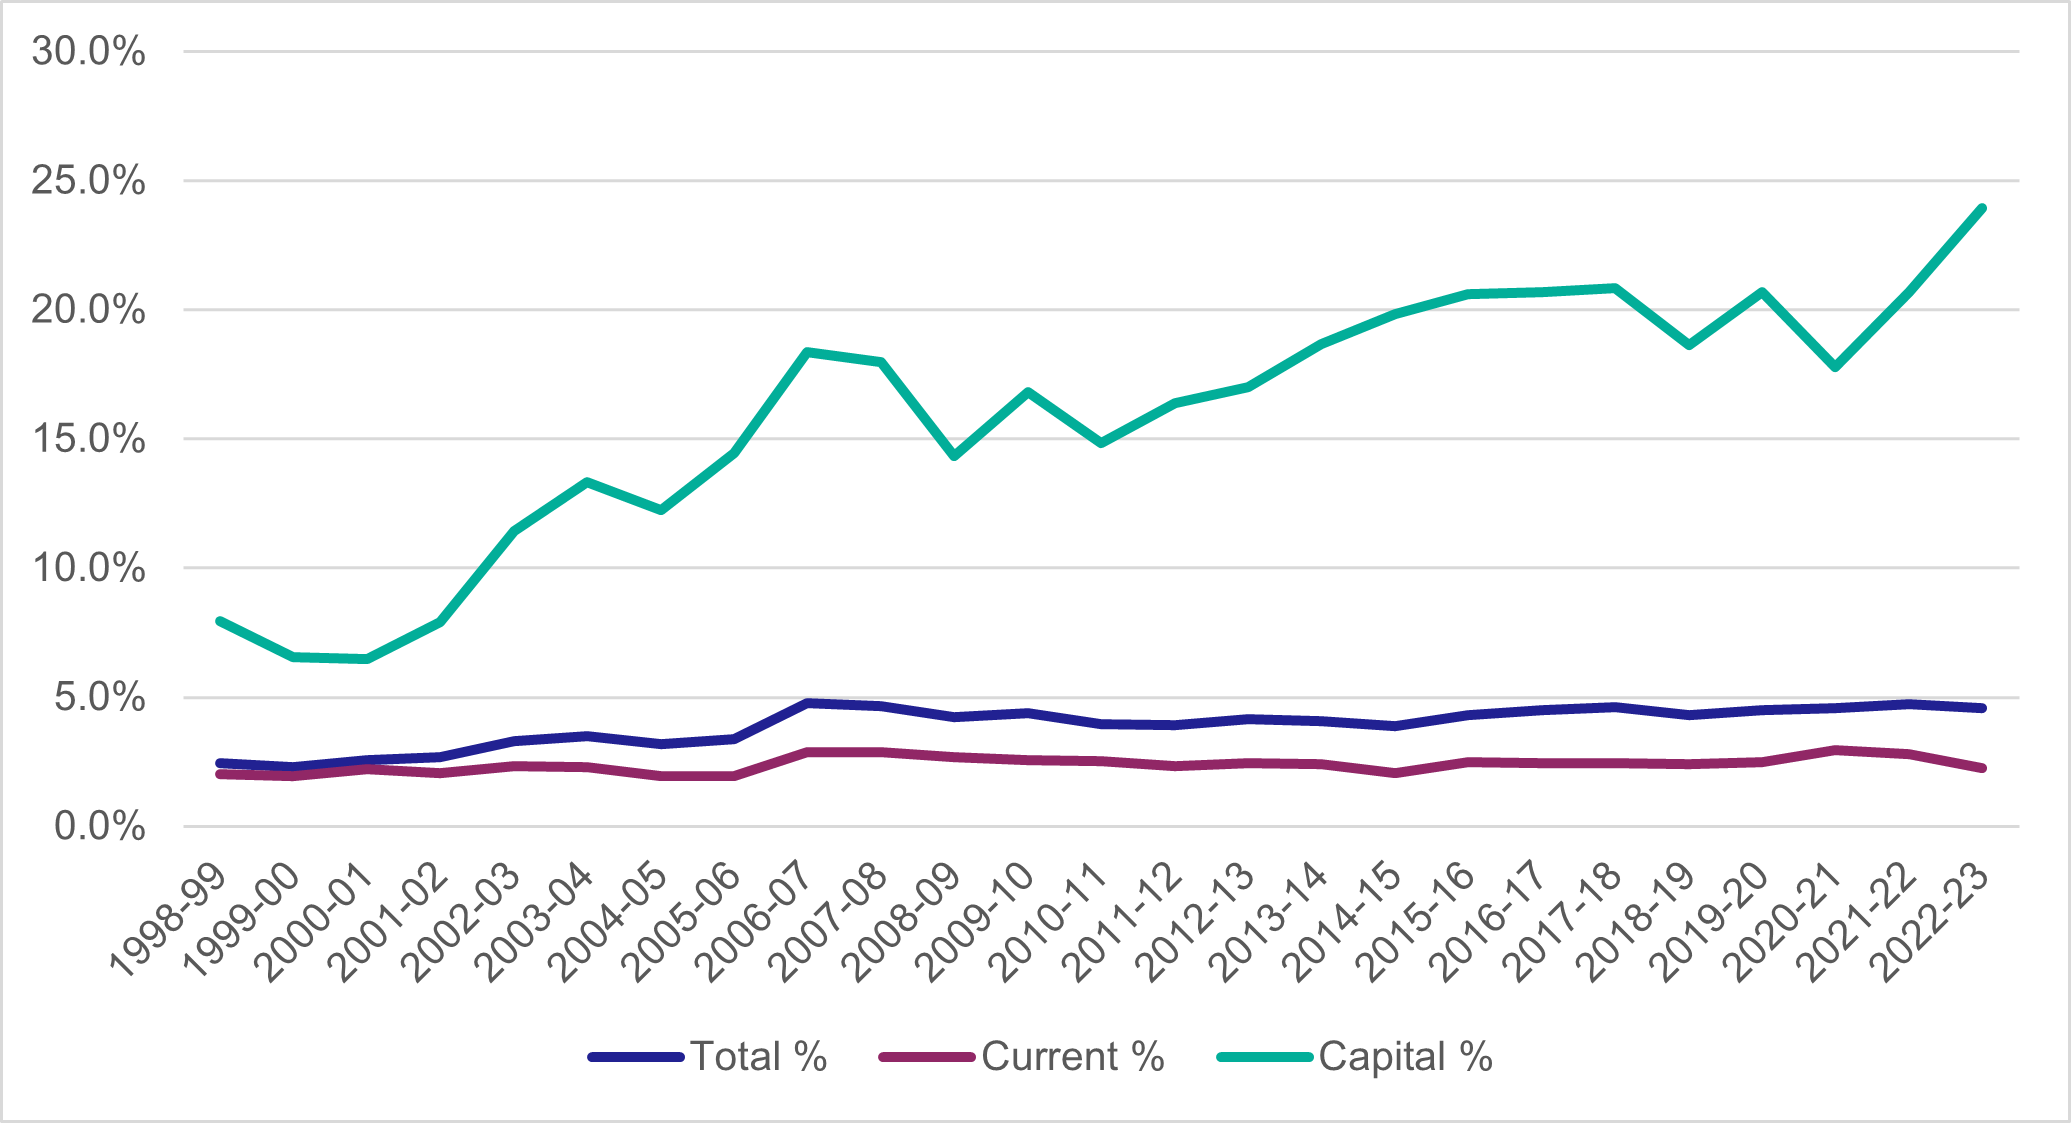
This context broadly sets out that, while transport spending has grown, it has done so broadly in line with other areas of public expenditure in Scotland. It also shows us that, relative to other areas, Transport has a high concentration of capital expenditure.
Context: The split of expenditure between different transport modes
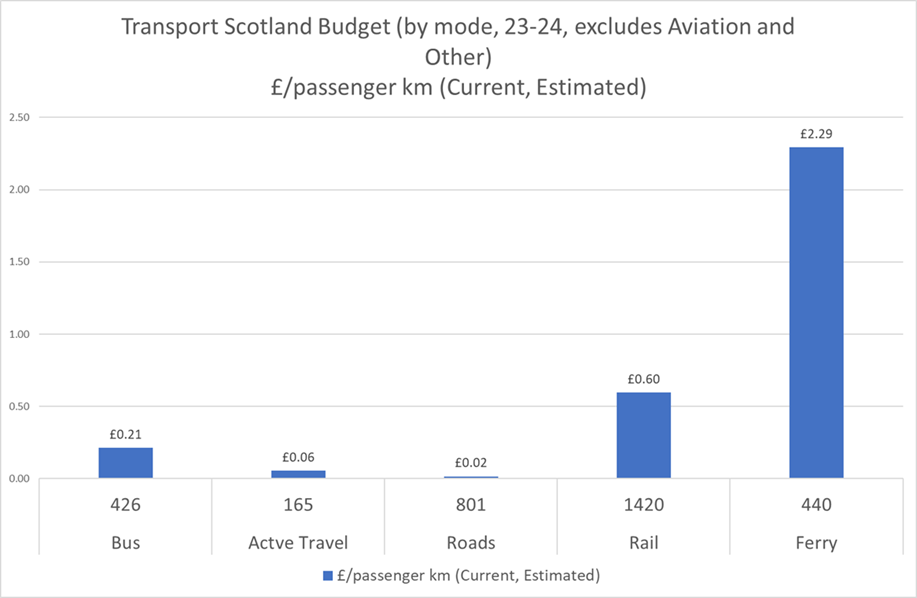
Figure 9 shows how the Transport Scotland budget (for 23-24) is split across modes on a £/passenger km basis. This needs to be treated with some caution as it is estimated, subject to considerable variation (especially for Active Travel) and does not account for freight (Ferry, Road, Rail), and Buses using (trunk) roads. The key issue is that the Transport Scotland budget is a mixture of revenue and capital support – expenditure on roads is primarily capital around the maintenance and enhancement of an asset, expenditure on bus is primarily revenue support (through concessionary fares to people and network support grant to operators) and rail and ferry are a mix of infrastructure investment and support for services. As such, in some sense the figures are not directly comparable, but the differences are interesting. To note that Rail, Active Travel, Ferries and Road include aspects of capital investment and the subsequent generation of assets so not a directly fair comparison with Bus.
Broadly speaking, Transport Scotland spend 3 times as much per passenger km on active travel (6p/km), than on roads (2p/km) and over ten times as much on bus (21p/km) than on (trunk) roads. Rail expenditure per passenger km (60p/km) is around three times that of bus and expenditure per passenger on ferries is around £2.30 per passenger km which reflects the nature of the ferry system as a lifeline service crucial to island and other communities.
Context: The role of subsidy versus the role of fare (and other) revenues in funding transport in Scotland
One key consideration for transport funding is that it is often made up of two parts – especially for transport modes where revenue is raised via fares paid by members of the public that use public transport. Depending on the mode of transport fares make up a significant part of the overall funding. However, this varies significantly from mode to mode, and it is less easy to draw up a robust summary and comparison of trends over time.
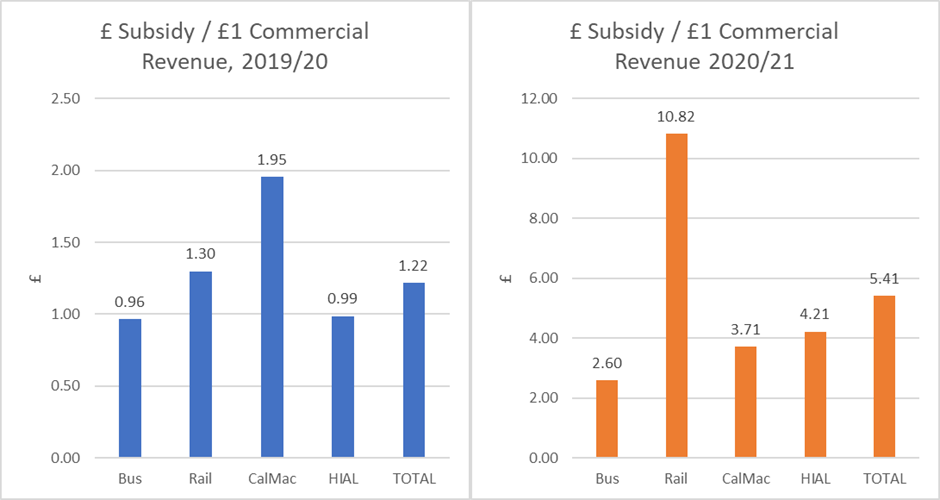
Pre-Covid 19 all modes got at almost as least as much from subsidy as commercial revenue. The impact of COVID was to hugely increase Public Transport subsidy, particularly for rail. This analysis requires publication of commercial accounts and the position for 2022/23 (latest available in most cases) was still influenced by C19 support, so adds little to the analysis.
Note that for rail, ScotRail were specifically asked to run circa 60% of services during lockdown, to provide travel for key workers, despite passenger services being very low.
For local bus services, Scottish Transport Statistics reports on passenger revenues and government support over time. Figure 11 below describes trends in both revenue streams:
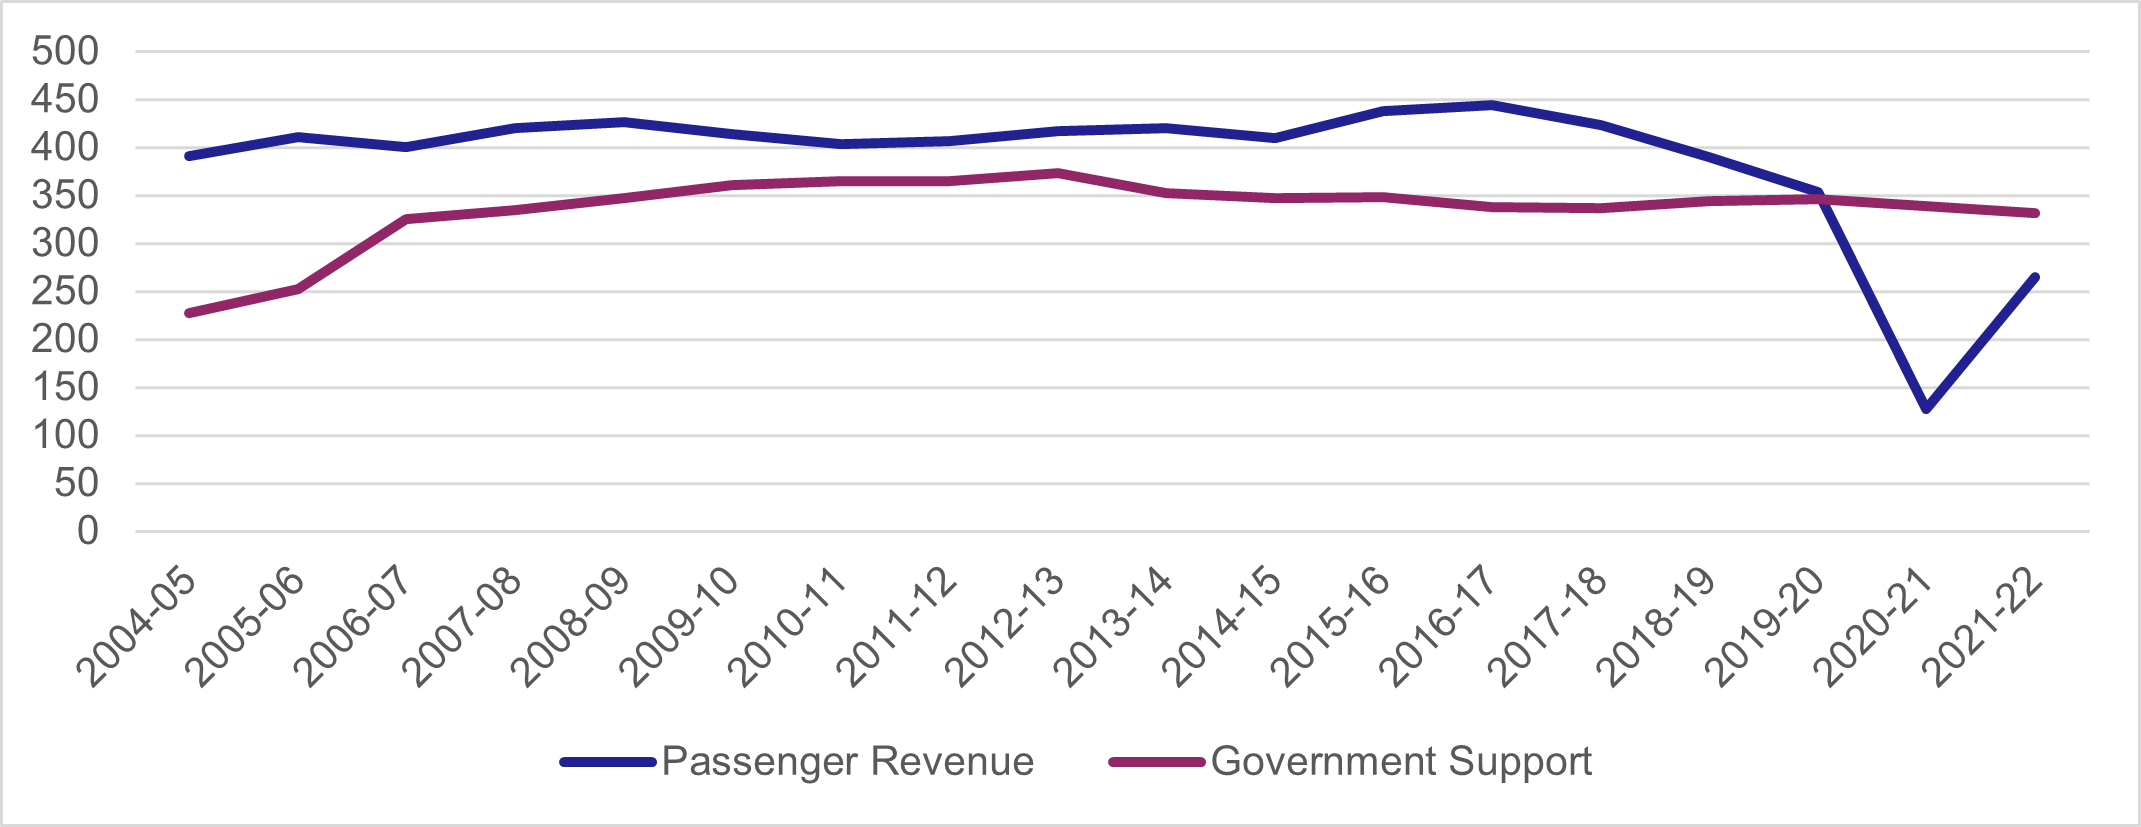
One of the obvious points from this chart is that passenger revenue fell dramatically during the pandemic and has not recovered since. This is in common with knowledge about other transport modes, although it’s not always possible to produce a similar chart/analysis due to a lack of comparable data on passenger revenue over time. Another key point is that, even prior to the pandemic, passenger revenue was declining as a proportion of total funding, going from a majority of funding to accounting for around 50% of funding. This ratio varies dramatically across transport modes even before taking into account the impacts of the pandemic. For example, CalMac annual reports and accounts show passenger revenue accounting for between 21% and 35% of total revenues over the past 4 accounting years (2019-2022).
See Calmac Annual Reports. Specifically, page 21 of the 2020 annual report, page 13 of the 2021 annual report and page 24 of the 2022 annual report were used to establish a time series.
Budget Constraints – Forward Look
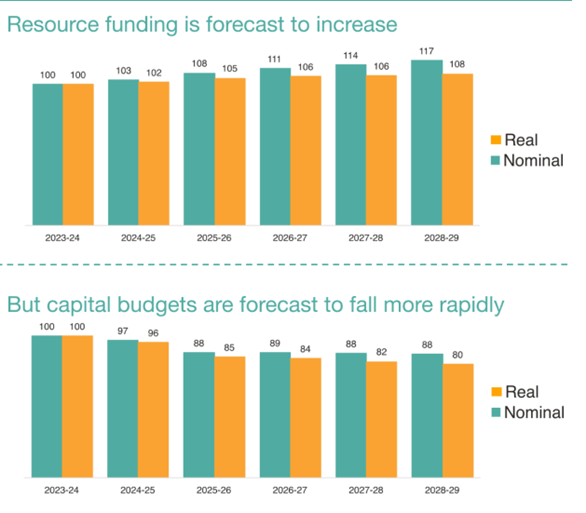
The Scottish Fiscal Commission published revised fiscal forecasts for the Scottish Budget on 19th December. Resource funding is forecast to rise over the next 5 years by 17% in nominal terms. After taking into account projected inflation, this is a rise of 8% by 2028-29. However capital funding is forecast to fall by 12% in nominal terms and 20% in real terms over the same period.
Source - Scotland’s Economic and Fiscal Forecasts – December 2023 – Scottish Fiscal Commission.
As detailed above, the SG resource budget is forecast to increase from £47.6 billion in 2024-25 to £54.0 billion in 2028-29 but £1.7 billion of this increase is forecast to be required for social security and demographic pressures mean that there will be a greater requirement for Health and Social Care expenditure over the period as well.
Source – Scottish Fiscal Commission
For capital, funding is forecast to fall from £6.2 billion in 2024-25 to £5.6 billion in 2028-29. Whilst this is obviously dependant on the policy decisions of future UK governments it represents a stark fall in investment, especially when considered in real terms.
The 2024-25 draft Scottish Budget projects spend of over £3.87 billion on transport across Scotland. Given the worsening outlook for capital, it will take more time to prepare the multi-year capital allocations and to refresh the infrastructure investment pipeline.
However, despite these constraints, we will invest almost £308 million in Active Travel, Low Carbon and Other Transport Policy in 2024-25, over £1.6 billion to operate, maintain and improve Scotland’s railway, over £1 billion for our critical safety, adaptation, maintenance and improvement priorities on the Trunk Road network and £526 million to expand our vital support for rural and island connectivity.
In terms of resource spend, the main items are support for bus with £370m allocated for concessionary fares and £50m for the Network Support Grant.
Summary of Transport in the Scottish Draft Budget 24-25.
- We will invest around £224 million to support high quality active travel infrastructure, sustainable travel integration and behaviour change investment to promote walking, wheeling, and cycling for everyday shorter journeys. This includes local government funding for Cycling, Walking Safer Routes.
- We are providing close to £36 million to support key low carbon transport initiatives, growing and developing electric charging infrastructure to accelerate the switch to zero emission vehicles and supporting decarbonisation of the bus sector.
- We are investing £147 million in a prioritised programme for Scotland’s Railway that includes Major Project Enhancements such as East Kilbride Improvements and the Levenmouth Rail Link, alongside development work for further electrification
- We will invest £488 million on the maintenance, safe operation and renewal of the Scottish rail network
- We will provide budget of almost £966 million to support the provision of the ScotRail and Caledonian Sleeper passenger rail services which includes the funding of fixed track access charges to Network Rail to support the maintenance, operation and renewal of the network.
- This includes additional budget to extend the Peak Fares Pilot an additional three months to the end of June 2024.
- We will focus our investments on the highest priority safety critical maintenance of our trunk road network, ensuring resilience to severe weather events and to deliver on our commitment to maintain a safe and reliable trunk road network.
- Spend on trunk road network safety, adaptation, maintenance and improvement will enable us to meet all our contractual and legal commitments as well as support our wider commitments on road safety, air quality and climate change adaptation.
- We will continue to progress with design and further development of our existing major infrastructure projects to achieve agreed improvements to existing routes including critical work on the A83 at the Rest and Be Thankful, and the A9 between Tomatin and Moy.
- We will spend £434 million in 2024-25 to support our lifeline ferry services, connecting our vital island communities and delivering grant support for priority harbor projects.
- We are supporting Highlands and Islands Airports Limited (HIAL) with a total budget of up to £61.7 million to maintain and operate rural and island airports and to reflect the profile of their capital plans.