Public use of transport – Trends and patterns
Weekly transport trends conclude that in the week ending 3 March 2024, rail patronage was down 11% on the equivalent week in 2020, pre-pandemic.
Concessionary bus travel patronage excludes the Young Person’s Free Bus Travel Scheme (Under 22’s scheme). It was down 23% on the equivalent week in 2020, pre-pandemic.
Car traffic was up 1% on the equivalent week in 2020, pre-pandemic.
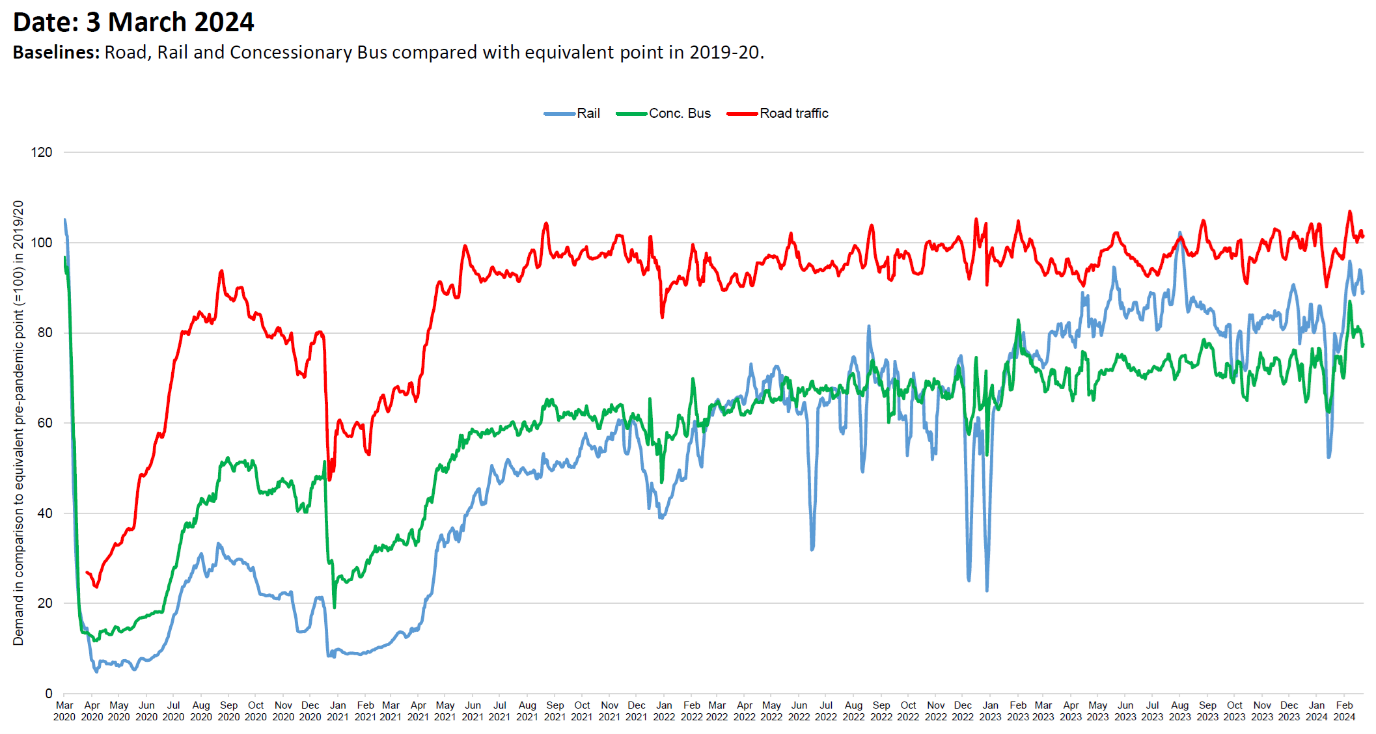
Compared to its equivalent pre-pandemic point, car, rail and concessionary bus, demand has recovered stronger on weekends than on weekdays however there are distinct differences in the extent of the recovery across modes.
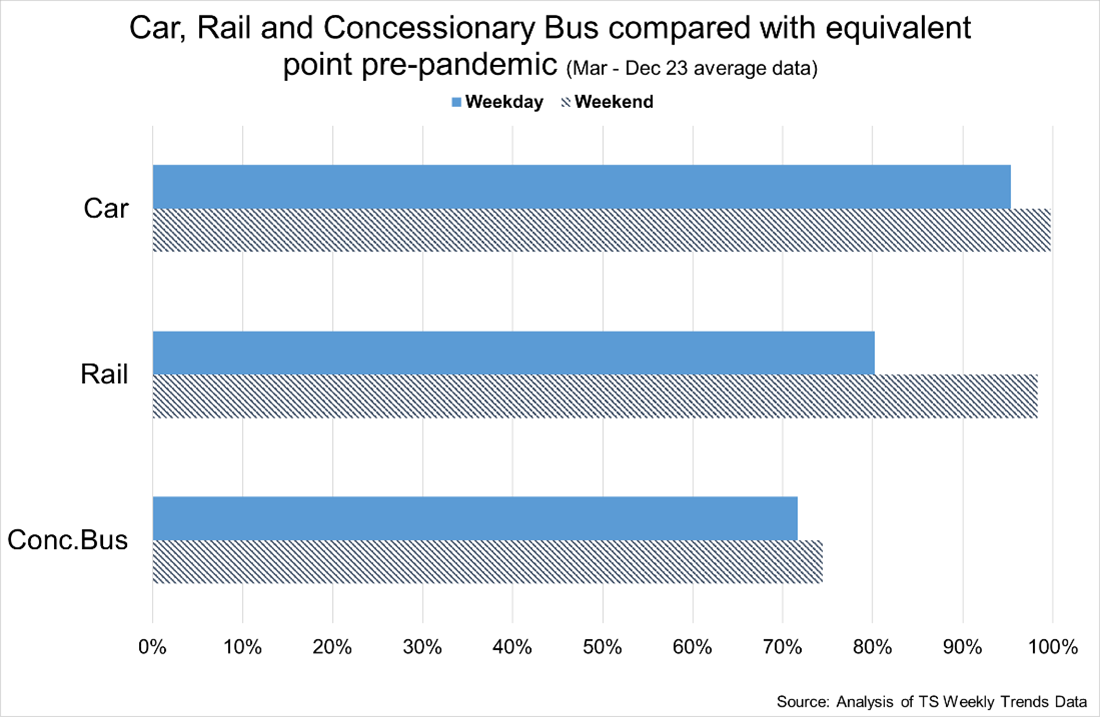
Private car demand has largely recovered however evidence suggested a shift away from commuting patterns with larger volumes of traffic on the weekend. Over the course of 2023, there was further recovery in both rail and concessionary bus use. On weekdays, the volume of rail travel is higher than concessionary bus, relative to pre-pandemic (80% and 72% respectively). In 2023, all bus travel was on average 90% of the volume of travel in the week 2nd – 8th March 2020.
How and why people travel
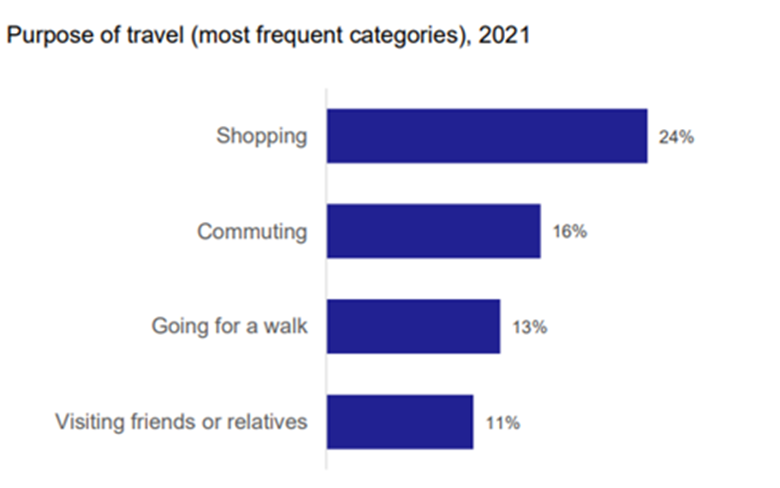
Data from Transport and Travel in Scotland 2022 allows an exploration of how and why people travel and how this varies across different groups of people. The most frequent purpose of a journey (24%) is shopping, followed by commuting (16%) with “going for a walk” (13%) and visiting friends or relatives (11%) being the next most common reasons. See Figure 15.
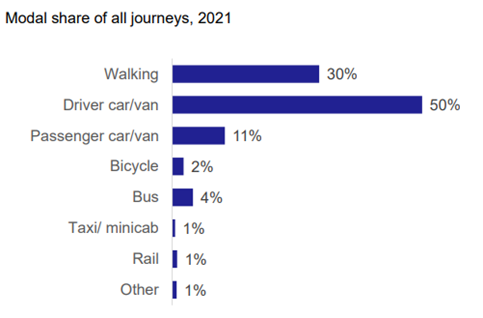
This is reflected in the mode share of all journeys with slightly less than a third (30%) being walking, and a half being by being the driver of a car/van. This compares starkly with the 11% of journeys as a passenger in a car/van and the small shares of cycling (2%), bus (4%) and rail (1%). See Figure 16.
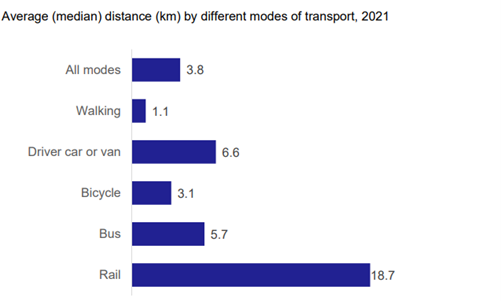
These differences are also reflected in the average distance travelled by the different modes. Compared with an overall median of 3.8km, walking (1.1km) and cycling (3.1km) trips are shorter than average whilst bus (5.7km) trips tend to be shorter than those by car (6.6km) and rail trips at an average of 18.7km tend to be the longest of all. See Figure 17.
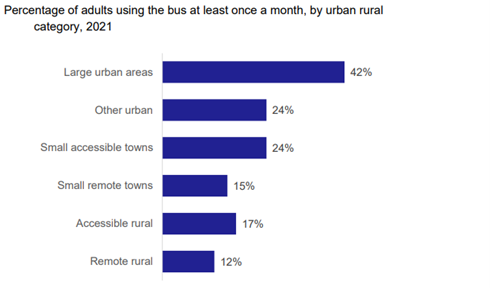
These travel patterns vary significantly. For example, whilst 42% of people in large urban areas use the bus at least once a month this falls to 24% in other urban areas and 12% in remote rural areas. See Figure 18.
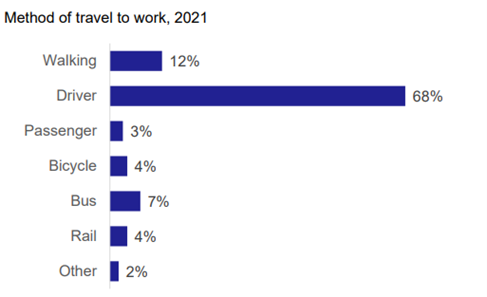
Looking specifically at commuting, the majority (68%) of people commute as a driver (with only 3% as a passenger) with 7% using the bus and 4% using rail or cycling whilst 12% of commutes are via walking. See Figure 19.
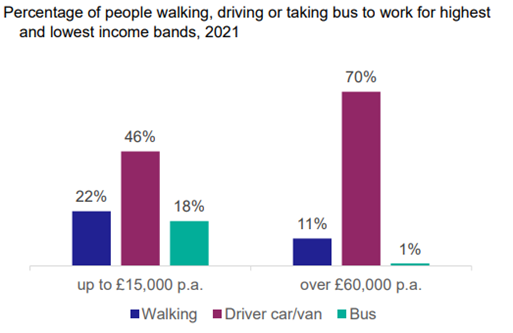
But even within commuting, these patterns vary significantly by income. Those on low incomes are twice more likely to walk (22%) than those on higher incomes (11%) and are 18 times more likely to use the bus. Commuting by car is also significantly more common for those on high incomes (almost 3/4 of trips) than those on low incomes but car use even amongst the poorest still accounts for almost half of commuting trips. See Figure 20
Public transport services and patronage levels
This section compares both services and patronage levels against pre-covid levels. This allows comparison against patronage over the years 2020-2023.
Note, bus data is indexed to a fixed week in March 2020 pre-pandemic whereas weekly rail data is relative to the equivalent pre-pandemic week in 2019-20. Bus comparison is based on ticketer data which covers commercial as well as subsidised bus travel excluding some operators. This is different to concessionary bus travel data shown in trends reports due its timely release.
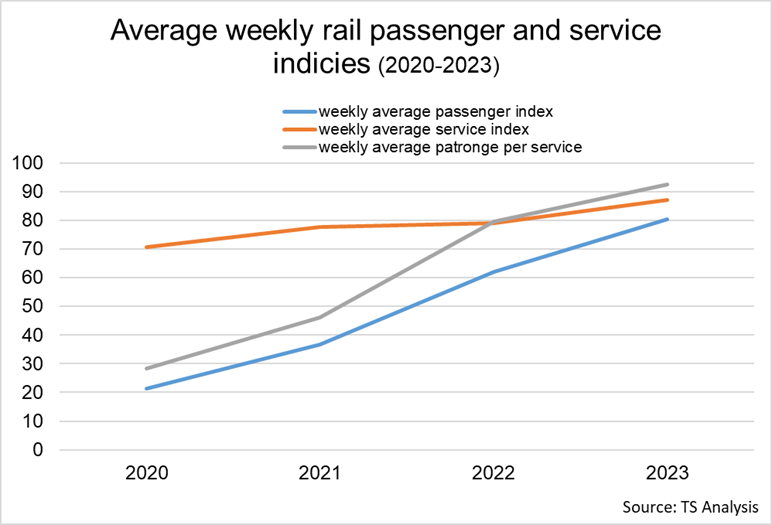
Rail
In 2023, planned rail service levels remain on average 13% below the pre-pandemic levels. Rail patronage per service increased significantly through the course of 2023, and was 92.5%, up from 79.6% in 2022. There is emerging evidence that the is a shift in patronage towards Additional leisure travel, particularly at weekends.
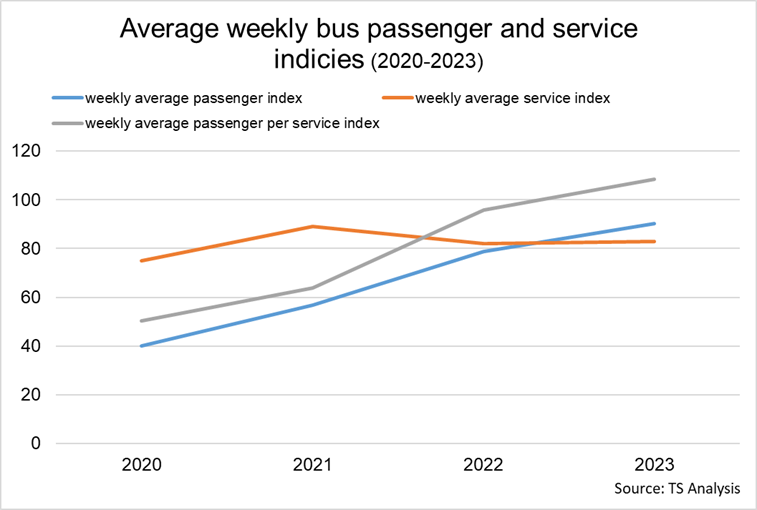
Bus
In 2023, bus services remain below pre-pandemic levels, operating at an average of 83% of the pre-pandemic level. Introduction of the Covid-19 Support Grant in June 2020 resulted in an uplift of service levels from the initial pandemic-related low, it has since been replaced with the Network Support Grant aiming to keep networks more extensive than would otherwise be the case. Bus services are now operating around 17% below pre-pandemic levels on average, slightly below rail which is operating at approximately 13% below. Due to lower service levels in 2023, combined with a recovery in demand following the easing of Covid-19 restrictions and the introduction of free bus travel for under 22s, the average passenger per service index has exceeded the pre-pandemic passenger per service index since August 2022.
Air Travel
In 2022, the volume of air passengers at Scottish airports was 21.5 million. This remains 26% below the pre-pandemic level of 28.9 million in 2019. Eurocentral forecast compared to the 2019 traffic levels, for the network: the number of flights is expected to react 92% in 2023, 98% in 2024 and 100% by 2023. See PowerPoint Presentation (eurocontrol.int)
On a monthly basis the Eurocentral forecast anticipates reaching 100% of 2019 during summer 2024. On a monthly basis the volume of air passengers at Scottish airports in September 2023 was 25.2 million, down from 29.1 million in September 2019, a decrease of 13%
In 2022, there was 1.3 million passengers at HIAL airports, down from 1.6 million in 2019, a decrease of 20%. On a monthly basis, there were 1.4 million passengers at HIAL in September 2023, down from 1.6 million in September 2019 (12% decrease).