Contributory factors to reported road collisions
Contributory factors to reported road collisions
Summary
This section describes the scope and limitations of the information on contributory factors collected as part of the road collision reporting system and presents Scottish results from the seventeenth year of collection.
- Driver/rider errors or reactions were reported in 54% of all reported collisions with failed to look properly the most common type (involved in 27%).
- Travelling too fast for the conditions or excessive speed was reported in 9% of all reported collisions and 22% of fatal collisions.
- Pedestrian only factors were reported in 17% of fatal collisions whilst failed to look properly and loss of control were the most frequently reported driver/rider factors (involved in 20% and 31% of fatal collisions respectively).
Introduction
From 2005, all police forces across Great Britain reported contributory factors as part of the stats19 collection. These were developed to provide insight into why and how road collisions occur. Their aim is to help identify the key actions and failures that led directly to the actual impact, to aid investigation of how it might have been prevented. Care should always be taken when interpreting the factors as they:
- reflect the reporting officer's opinion at the time of reporting the collision (or the opinion of a person whose duties include deciding which CFs should be recorded based on the officer's report).
- are based on the information which was available at that time, so may not be the result of subsequent extensive investigation (indeed, subsequent enquiries could result in the reporting officer opinion changing).
A reporting office attending the scene of a road collision may select up to 6 contributory factors (from a list of 77) to assign to that collision. Multiple factors may be listed against any participant or vehicles in the collision, (therefore percentages in the tables provided may not sum to 100).
Because of this, analysis of contributory factor information requires careful consideration; figures will differ depending on the focus of the analysis. Care should be taken when interpreting tables provided here which consider different aspects of the data (i.e. collisions, vehicles/participants, casualties and frequencies).
This section presents analysis from collisions in Scotland reported to the police in 2021, with the following background note describing the collection of the contributory factor system in more detail.
Note that most tables are by individual contributory factor so care needs to be taken when carrying out analysis. Adding together numbers for individual contributory factors will result in some double counting e.g. some collisions will have 'exceeding speed limit' and 'driving too fast for the conditions' recorded as a factor.
Collisions
Categories
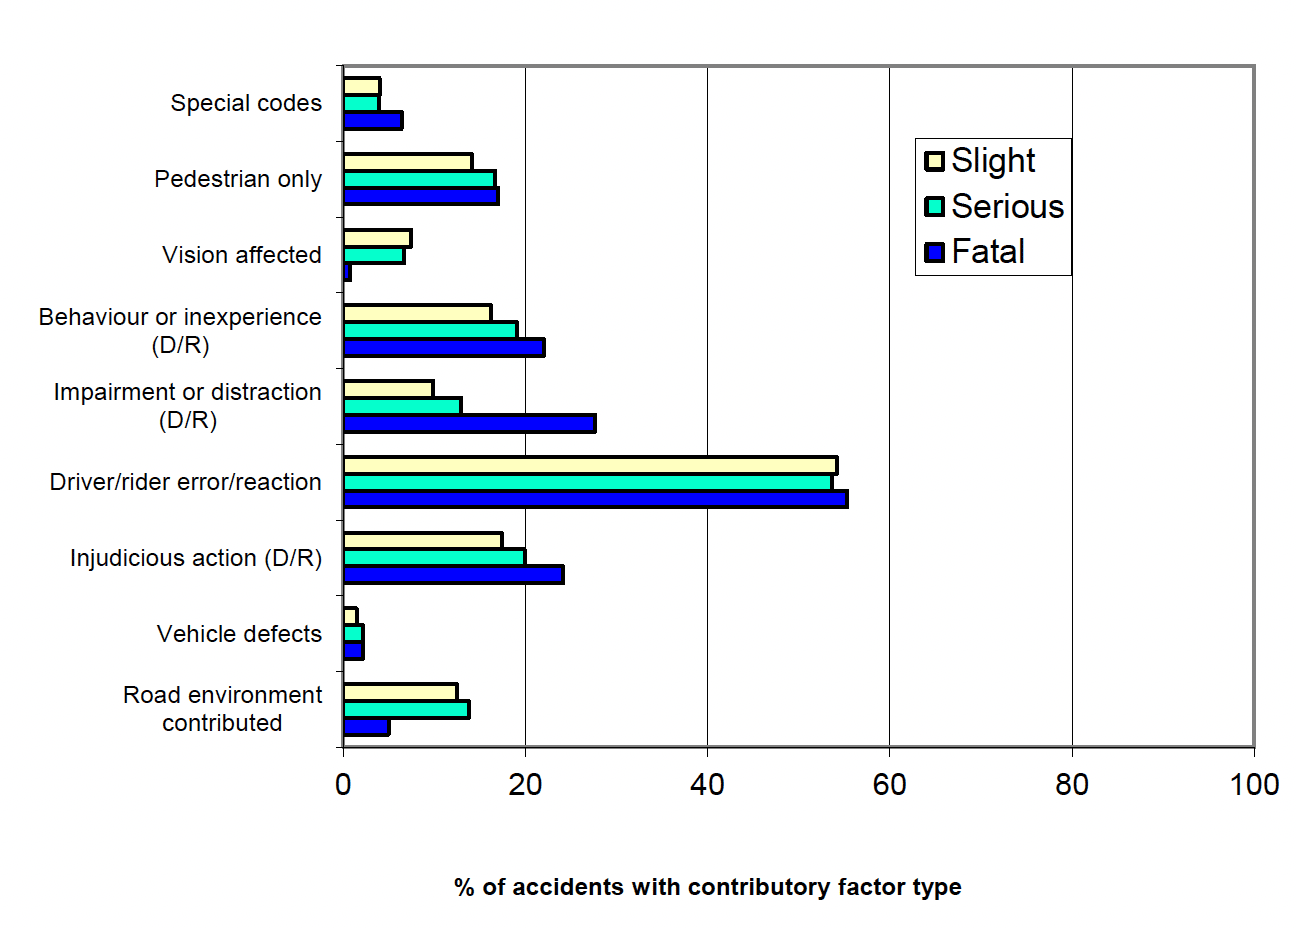
Each of the 77 contributory factors fits into one of nine categories. Figure 11 shows the percentage of collisions reported to the police with associated contributory factors in each these categories.
- Driver/rider error was the most frequently reported category for each type of severity of collision and was reported in 54% of collisions reported to the police).
- Pedestrian contributory factors (where the factor has been attributed to an injured or uninjured pedestrian involved in the collision), were reported in 15% of reported collisions, rising to 17% of fatal collisions.
- Injudicious action (including travelling too fast for conditions, following too close or exceeding speed limit) was involved in 19% of all reported collisions and 24% of fatal collisions.
- Road environment factors were reported in 13% of reported collisions.
Factors
On average there were 1.7 contributory factors listed per reported collision with more factors recorded for fatal collisions and fewer for slight collisions. Table M shows the numbers (and percentages) of reported collisions in which each contributory factor was reported.
- Failed to look properly was the most frequently reported contributory factor, involved in 27 % of all reported collisions. This was followed by careless / reckless or in a hurry (13%), failed to judge other person's speed and loss of control (both 12%), poor turn/manoeuvre (8%), pedestrian failed to look properly (8%), Slippery road (7%) and travelling too fast for the conditions (6%) were also in the top six.
- Travelling too fast for the conditions or excessive speed was reported in 9% of all reported collisions and 22% of fatal collisions (Note that the individual percentages for each of these factors cannot simply be added together to obtain combined totals.)
- For fatal collisions, loss of control was the most frequently reported driver/rider factor involved in 31% of collisions. Failed to look properly was reported in 20%, careless/reckless or in a hurry in 17% and exceeding the speed limit in 16%. Pedestrian wearing dark clothing at night were involved in 6% and pedestrians who failed to look properly were involved in 4% of fatal collisions.
Table M also shows how the incidence of some CFs varies with the severity of the collision. For example: loss of control is cited in 12% of all collisions for which CFs were recorded but 31% of fatal collisions and exceeding speed limit is cited in 5% of all collisions but 16% of fatal ones.
Note that repeats of the same contributory factor within an collision are excluded from the table, however an collision will appear more than once if more than one different contributory factor is reported.
Changes over time
Table N compares the top ten contributory factors listed in 2022 against previous years. These top ten factors remained the same in all five years, though the order and frequency changed over the 17 years of collection.
Vehicle & pedestrians
Table O shows the number and percentage of vehicles assigned each type of contributory factor (for each vehicle involved in an collision reported to the police). Table P shows this for pedestrians only.
- Failed to look properly was the most frequently reported factor both overall (reported in 16% of all vehicles' factors), and for every vehicle except motorcyclists.
- Loss of control (15%) was the most commonly reported factor for motorcyclists.
- Careless/reckless or in a hurry (D/R) was the second most common factor reported for cars or taxis (8%).
- Failed to judge other person's path/speed, poor turn or manoeuvre and Cyclist entering road from pavement were the second most common factors associated with cyclists (associated with 4% of bicycles).
- Failed to judge other person's speed/path was the second most common factor reported for goods vehicles (reported in 9%).
- Careless, reckless or in a hurry was associated with a total of 8% of all vehicles involved in reported collisions.
- Pedestrians involved in collisions were most likely to have failed to look properly as an associated contributory factor (recorded in 39% of all pedestrian collisions), followed by careless / reckless /in a hurry (14%) and impaired by alcohol, failed to judge vehicles path or speed and crossed road masked by stationary/parked vehicle (all 9%).
Table O also shows that many contributory factors were rarely recorded for most vehicles, for example:
- loss of control was recorded for 15% of motorcycles but only 3% of vehicles in the bus/coach/minibus grouping;
- sudden braking was recorded for 6% of buses but for only 1% of all vehicles involved.
On average, fewer contributory factors were recorded for pedal cycles (an average of 0.48 per pedal cycle involved in a reported collision) and bus or coaches (an average of 0.50), compared to an overall average of 0.83 factors per all vehicles.
Note that percentages differ from Tables M & N which presents the percentage of collisions with each contributory factor. As more than one vehicle may be involved in an collision, the average number of factors associated with an individual vehicle is generally lower.
Pairing of factors
Table Q shows the most frequent pairs of contributory factors assigned to the same reported road collision participant in 2022.
- The most frequently-occurring combination is driver/rider failed to look properly + (driver/rider) failed to judge other person's path/speed, which was recorded on 154 occasions.
- As would be expected, the CFs identified (earlier) as most frequent to appear in several of the most frequently-occurring combinations – for example, (driver/rider) failed to look properly occurs in the first three of the most frequently-occurring combinations.
However, the numbers indicate that even the most frequently-occurring combination of CFs arose in only a small proportion of all collisions.
Casualties
Tables R & S show the number (and percentage) of fatal and seriously injured casualties involved in collisions where each contributory factor was reported. Unsurprisingly the pattern is similar to that seen in Tables M & N showing the number of collisions with each factor reported
Note a casualty will appear in the tables against each (unique) factor associated with the collision (resulting in the casualty) and therefore may appear more than once. As with the collision tables, repeats of the same contributory factor within an collision are excluded.
Fatalities
Table R shows the Contributory Factors associated with the largest numbers of deaths were:
- Loss of control – 54 deaths (representing 34% of all deaths in collisions for which CFs were recorded);
- (driver/rider) failed to look properly– 29 deaths (18%);
- Careless / reckless /in a hurry (D/R) – 28 deaths (18%);
- Exceeding the speed limit – 26 deaths (17%);
- Illness or disability (mental/physical) (D/R)– 21 deaths (13%);
- Travelling too fast for the conditions – 17 deaths (11%)
- Poor turn or manoeuvre – 16 deaths (10%);
Seriously injured
Table S shows the CFs associated with the largest numbers of serious injured were:
- (driver/rider) failed to look properly – 388 (representing 25% of all serious injuries in collisions for which CFs were recorded);
- loss of control – 270 serious injuries (17%);
- (driver/rider) careless / reckless / in a hurry – 238 (15%)
- (driver/rider) failed to judge other persons path/speed –175 serious injuries (11%) ;
- Poor turn or manoeuvre – 128 (8%);
- Travelling too fast for the conditions – 119 (8%)
- Pedestrian failed to look properly – 119 (8%)
- Slippery road (due to weather) – 117 (7%)
Overall frequencies of recording
In 2022 at least one contributory factor was recorded in 99.9% of reported collisions where a police officer attended the scene (3,395). A total of 5,821 factors were recorded, resulting in an average of 1.7 factors per collision.
Around 85% (4,921) of all factors listed related to vehicles (and their drivers/rider) and the road environment. Around 13% (730) related to pedestrians who were casualties. Relatively few related to uninjured pedestrians (33 or 0.6%).
Table T presents a ranking of all 77 factors by the frequency of reporting in 2022. (Note that figures differ from earlier tables as repeats of factors within the same collision are counted). It is apparent that some CFs are not used often – many were used fewer than 100 times.
Note that data relating to all reported CFs were used to produce Tables O to T. In cases where the same CF applies to more than one vehicle in the same collision, it is counted once for each of them. These tables therefore differ from Tables M & N (which exclude repeats of the same CF within an collision).
Possible vs. Very likely
Reporting officers record whether it was thought very likely or just possible that a factor contributed to the occurrence of the collision. Table T also shows how often each CF was described as very likely, and how often as possible.
Overall, just under three quarters of CFs (74%) were described as very likely, but the percentage varied markedly between different CFs. Excluding those used fewer than 100 times, the following were described as very likely on at least 72% of occasions on which they were used:
- Disobeyed Give Way or Stop sign or marking (89%)
- Pedestrian failed to look properly (85%)
- Impaired by alcohol (D/R) (84%)
- Loss of control (82%)
- (driver/rider) failed to look properly (79%)
- Poor turn or manoeuvre (77%)
- (driver/rider) Careless / reckless /in a hurry (76%)
- Pedestrian careless / reckless /in a hurry (75%)
- Slippery road (due to weather) (72%)
- Failed to judge other person's path/speed (driver/rider) (72%)
and the following were described as very likely between 60 and 68 of the occasions on which they were used:
- Travelling too fast for the conditions (68%)
- Exceeding speed limit (68%)
- Following too close (65%)
- Dazzling sun (60%)
Conclusion
The collection of contributory factors has been part of the GB wide police reporting system for 17 years. It is clear contributory factor information can provide useful indications of the circumstances that may have led to a reported road collision. These can also be attributed to the different participants within the collision, which can help build a picture of how the collision may have occurred.
However, there are limitations to the system and care should be taken when both analysing and interpreting the results. This should help ensure the data is used in the correct manner and that consistent messages/results are achieved by users.
We welcome comments on the analysis presented here or any questions regarding the contributory factor system.
Transport StatisticsTransport Scotland
Victoria Quay
Edinburgh EH6 6QQ
Telephone: 0131 244 7254
Email: Transtat@transport.gov.scot
Background: The collection of Contributory Factor data
Guidance on recording road collisions is provided in the Department for Transport's Stats20 document which includes the following points on CFs:
- CFs reflect the reporting officer's opinion at the time of reporting, and may not be the result of extensive investigation;
- subsequent enquiries could result in a change in the reporting officer's opinion;
- the CFs are largely subjective, and depend upon the skill and experience of the investigating officer to reconstruct the events which led directly to the collision;
- the need to exercise judgement when recording CFs is unavoidable;
- CFs should be identified on the basis of evidence from sources such as witness statements and vehicle and site inspections;
- the evidence may be of variable quality, so the officer should record very likely or possible for each CF;
- when there is conflicting evidence (e.g. conflicting witness statements), the reporting officer should decide on the most credible account of the collision and base the codes on this, taking into account all other available evidence.
Some CFs may be less likely than others to be recorded, since clear evidence of them may not be available, or may be very difficult to obtain, after an collision has occurred (e.g. in the case of the nervous, uncertain or panic factor). Participants and witnesses may provide incomplete or conflicting accounts of what happened. The CF data therefore depend upon the skill and experience of the reporting officer to reconstruct the events which led directly to the collision, and so are more subjective in nature than other Stats 19 data. This should be kept in mind when using these results.
Regardless of the number of vehicles involved in the collision, at most six sets of CF data can be recorded per collision. Each set contains three pieces of information:
- a factor which is thought to have contributed to the occurrence of the collision – selected from list of 77 , such as:
- exceeding speed limit (CF code 306);
- travelling too fast for the conditions (307);
- failed to look properly (405);
- impaired by alcohol (501);
- impaired by drugs (illicit or medicinal) (502)
- the participant in the collision to whom the factor is related:
- whether this is a:
- Vehicle – in which case the factor may relate to the driver/rider or to the road environment;
- Casualty – a pedestrian or a passenger in a vehicle; or
- Uninjured pedestrian.
- if a Vehicle or a Casualty, the relevant Stats 19 reference
- whether this is a:
- whether it was thought very likely or just possible this factor contributed to the occurrence of the collision
Therefore more than one factor may be recorded for the same participant and any given factor may be recorded for two or more different participants, subject to the limit of a maximum of six sets of CF data per collision.
Appendix B of this publication illustrates the CF codes and their descriptions, including a brief set of completion instructions for the reporting officer. More detailed information is available in the DfT's Stats 20 document (pages 10; 84 -101) and the procedure for allocating them – for example:
- the CFs may be recorded in any order (so nothing can be inferred from the order in which they appear);
- more than one CF may be related to the same road user; and
- the same CF may be related to more than one road user.
Worked example
Clearly, there could be a lot of CF information in the case of an collision which involved several vehicles, if it was thought that several of them contributed to its occurrence. The following is an example of the potential complexity of the CF data. Car 1 is rapidly travelling along a straight road when Car 2 suddenly appears in front of it, having emerged from a pub car park. The driver of Car 1 brakes sharply, to avoid a collision. As Car 2 drives off, Car 1 is hit from behind by a motorcycle, whose rider and passenger are both killed. The following might be recorded as the CF data for this collision:
| CF no. | Participant | Contributory Factor | How likely? |
|---|---|---|---|
| 1 | Car 1 | Exceeding speed limit | Possible |
| 2 | Car 2 | Impaired by alcohol | Possible |
| 3 | Car 2 | Failed to look properly | Very likely |
| 4 | Car 1 | Sudden braking | Very likely |
| 5 | Motorcycle | Following too close | Very likely |
| 6 | Motorcycle | Exceeding speed limit | Possible |
This collision has three participants and six CFs, two of which are the same (exceeding speed limit) but apply to different participants (Car 1 and Motorcycle). This example will be referred to from time to time, when describing some of the CF results.
Quality
As the CFs were added to the Stats 19 data specification at the start of 2005, the results for 2005 could have been affected by teething troubles. In June 2006, the Liaison Group on Road Collision Statistics (LGRAS) discussed a paper on aspects of the quality of the data. It also remains the case the recording of CFs varies between Police Forces. In 2009, there were around 2.1 CFs per collision for Scotland; varying between 1.5 and 2.6 between Forces. In addition, while most Police Forces' CFs are allocated by the reporting officer, in one Force they are allocated by a small team of specialist CRASH investigators. It may be that a higher degree of accuracy exists for fatal and serious collisions than for slight collisions, as the former may be attended by more experienced road policing officers.
On introduction inconsistencies arose between the CF code and the Type of Participant code (around 3-4% in 2005). The most frequent problem was the combination of the CF code for pedestrian failed to look properly with the Type of Participant code for a Vehicle. In such cases, it wasn't possible to deduce (from the data) which was incorrect. Since then additional quality assurance was introduced leading to an improvement in quality (currently around 1% of cases).
There may be other changes in some of the patterns of the reporting of CFs, as a result of such discussions, the introduction of additional computer cross-checks of the data, Police Forces' increasing experience of the collection and recording of such information, and the use of the data by the Police, local authorities and central government.
< Previous | Contents | Next >