Chapter 13 - Environment
Chapter 13 - Environment
1. Introduction
1.1 This chapter provides information about the impact of transport on certain aspects of the environment with a focus on greenhouse gas emissions and air quality. Statistics include atmospheric pollutants and emissions of greenhouse gases by types of transport as well as details of emissions levels of road vehicles. Data from other chapters within Scottish Transport Statistics are referred to in the analysis.
Key points
- In 2020 (the most recent year available), transport (including international shipping and aviation) accounted for 26% of Scotland's greenhouse gas emissions under the definition set out in the Climate Change Scotland Act.
- Road transport made up 66% of transport greenhouse gas emissions.
- Through September of 2020 there were 6,545 Ultra Low Emission Vehicles registered in Scotland for the first time – 80% up on the corresponding period in 2019.
- In 2020, transport accounted for 58% of emissions of oxides of nitrogen, 17% of particulate matter PM10 and 21% of particulate matter PM2.5. As at 31 August 2022, there were 38 active Air Quality Management Areas related to these pollutants.
2 Main Points
Air pollutant emissions
2.1 The main pollutants of current concern in Scotland are:
- Nitrogen oxides (NOx);
- Particulate matter (PM10 and PM2.5);
- Sulphur dioxide (SO2);
- Non-methane volatile organic compounds (NMVOCs);
- Ground-level ozone (O3); and
- Ammonia (NH3).
2.2 Of these pollutants, transport is a significant contributor to emissions of oxides of nitrogen and particulate matter. Transport is also linked to ground level ozone, which is a secondary pollutant produced by chemical reactions involving oxides of nitrogen.
2.3 Historically, transport was also a major contributor to emissions of lead and non-methane volatile organic compounds (NMVOCs). The significant decline in lead emissions (98% since 1990) has been mainly driven by the progressive phasing out of leaded petrol. The lead content of petrol was reduced from around 0.34 g/l to 0.143 g/l in 1986. From 1987, sales of unleaded petrol increased, particularly as a result of the increased use of cars fitted with three-way catalysts. Leaded petrol was phased out from general sale at the end of 1999. For NMVOCs, transport sector emissions declined significantly during the 1990s due to the increased use of catalytic converters and fuel switching from petrol to diesel cars. (Chart 13.1a – note that the jump observed in 2005 is due to a revision of the figures for 2005 onwards, as detailed in the notes and definitions section 13.3.6).
2.4 Emissions of nitrogen oxides (NOx) were estimated to be 82kt in 2020 of which transport accounted for 58%. Since 1990, transport emissions have declined by 68%. Transport emissions have declined due to a number of reasons including the requirement for new petrol cars to be fitted with three-way catalysts since 1989 and, in more recent years, "Euro standards" for new cars have driven a reduction in emissions, although studies show that the diesel Euro 5 cars have not performed as well as expected. Since 2008, there has been a general reduction in the emissions from passenger cars, mainly driven by improvement in catalyst repair rates. In 2020, diesel cars and light goods vehicles (LGVs) accounted for 26% of NOx emissions from transport compared with less than 2% in 1990 (Table 13.1a).
2.5 Emissions of PM10 were estimated to be 11kt in 2020, of which transport accounted for 17%. Since 1990, transport emissions have declined by 73%. For particulate matter, the main source of transport emissions is non-exhaust emissions from tyre and brake wear and road abrasion. In 2020, these accounted for 60% of PM10 emissions from transport compared with 14% in 1990. Since 1990, exhaust emissions from road transport have decreased by 89% due to the penetration of new vehicles meeting tighter PM10 emission regulations ("Euro standards" for diesel vehicles were first introduced in 1992). Over the same period emissions from shipping fell by 87% (Table 13.1a).
2.6. Emissions of PM2.5 were estimated to be 6kt in 2020 of which transport accounted for 21%. Trends in emissions of PM2.5 from transport follow a similar pattern to those for PM10. PM2.5 accounts for all road transport exhaust PM10 emissions and most of such emissions from shipping but only around 54% of PM10 emissions due to road abrasion and tyre and brake wear.
2.7 There has been a notable difference in the changes observed for NO2, PM10 and PM2.5 for 2019 to 2020 compared to the earlier year-to-year changes. From 2011-2019 the annual decreases for all three pollutants have been below ten percent. By contrast the decreases from 2019 to 2020 were 19 percent for NO2, 24 percent for PM10 and 26 percent for PM2.5. This is likely to have been strongly influenced by the reduction in vehicle use during the restrictions which were in place during 2020 due to the Covid-19 pandemic.
Air quality
2.8 Concentrations of air pollutants are sampled at automatic monitoring sites and the information is held in the "Scottish Air Quality Database" on the "Air Quality in Scotland" website (http://www.scottishairquality.co.uk/), The data section of the "Air Quality in Scotland" website provides detailed information on all sites while the publication section of the website includes reports showing trends. Table 13.b in this publication shows concentrations of nitrogen dioxide, ozone and PM10 at a mixture of urban and rural monitoring sites with long time series. Air quality is monitored against standards set as air quality objectives (see environment section of the user guide).
Nitrogen dioxide (NO2)
2.9 For many of the selected monitoring sites, nitrogen dioxide concentrations show a downward trend. In 2021,two of the 7 selected operational sites that recorded nitrogen dioxide concentrations with a data capture rate of over 75% had the lowest concentrations recorded over the period 2011-2021. In 2021, 73 sites in Scotland recorded nitrogen dioxide concentrations with a data capture rate of over 75%, of which 62 were roadside or kerbside locations. One of these 73 sites had concentrations in excess of the air quality strategy objective of 40 g/m3 as an annual mean (Table 13.1b).
Ozone (O3)
2.10 Though transport emissions contribute to ozone formation, levels of ozone are generally higher in rural areas due to the long-range transportation of primary pollutants from urban sources. In addition, ozone reacts with nitric oxide, which is more abundant in urban areas due to traffic emissions, to form nitrogen dioxide; therefore ozone levels are usually lower in urban areas. While at the selected monitoring sites there has been some indication of a downward trend in the number of occurrences of maximum daily concentrations exceeding 100 g/m3, this has since levelled off. There appears to be no clear trend in average annual concentrations. In 2021, all of the 8 sites in Scotland recording ozone with a data capture rate of over 75% met the air quality objective of no more than 10 occurrences of the maximum daily concentrations exceeding 100 g/m3 (Table 13.1b)
Particulate matter (PM10)
2.11 PM10 concentrations show a general downward trend at the selected sites. In 2021, of the 66 sites in Scotland recording PM10 with a data capture rate over 75%, no sites had concentrations greater than the air quality objective of 18 g/m3 as an annual mean. No site exceeded the air quality objective set as 7 occurrences of a daily mean above 50 g/m3. (Table 13.1b)
Air Quality Management Areas
2.12 Whenever it appears that one or more of the air quality objectives is unlikely to be met by the required date, the local authority concerned must declare an Air Quality Management Area (AQMA) covering the area of concern. The authority must then prepare and implement an action plan outlining how it intends to tackle the issues identified. Table 13.1c summarises active AQMAs and the pollutants of concern. As at 31 August 2022, there were 38 active AQMAs, all but one of which related to either NO2 or PM10, or both.
Greenhouse gases
2.13 In 2020, Transport (including international aviation and shipping) accounted for 10 million tonnes of carbon dioxide equivalent (MtCO2e). This represents 25.9% of total net greenhouse gas emissions allocated to Scotland in the Greenhouse Gas Inventories, 5% lower than 2019. Total net emissions from all sources decreased by 12% between 2019 and 2020 falling from 45.4 MtCO2e to 40.0 MtCO2e, with transport total emissions having decreased from 14.0 MtCO2e to 10.3 MtCO2e, a fall of 26%. Within Transport emissions, Road Transportation accounted for approximately 70.4% of the transport total. Heavy Goods Vehicles and Light Goods Vehicles were the other significant contributors to transport emissions accounting for 14.7% and 13.5%, respectively. International Aviation and Shipping contributed roughly 7.8% and domestic aviation 3.4% of transport's total emissions. The contribution from domestic shipping, 17.2%. It should be noted that these estimates use a methodology designed to produce internationally-comparable figures so apparent year-to-year fluctuations could be due in part to limitations in or changes to the underlying data or calculations. See Table 13.2 for more detail and emissions from earlier years and the user guide for more detail on the methodology used.
2.14 Figure 13.2 shows transport emissions over time, by mode. Estimated car emissions have fallen by 37% since 2006. Traffic levels (vehicle km) have increased slightly over the last few years so the reduction in emissions seen will be due to the introduction of more fuel efficient vehicles as well as other more fuel efficient driving, particularly in the business fleet. More detail on car emissions is set out from paragraph 2.16 of this chapter while more details on traffic volumes by mode can be found in chapter 5 of STS. Details of personal modal choice can be found in chapter 11.
2.15 The Greenhouse Gas Inventories report the emissions of the six gases that are listed under the Kyoto Protocol. In the case of transport, the quantities of gases involved are relatively small except for carbon dioxide, which accounts for about 99 per cent of transport's total. (Table 13.3).
2.16 Table 13.4 presents some comparisons between the UK as a whole and Scotland. Overall, Scotland's transport emissions account for 8% of the UK total. At 16% Scottish bus emissions are above a proportionate share of the UK total, while domestic aviation, at 16%, is also above that benchmark.
2.17 Estimates of carbon dioxide emissions per passenger-km for different modes of transport are available only for GB/UK as a whole. The lowest emitting modes of land transport per passenger-km are coaches at 27 gCO2e; and light rail and tram at 29 gCO2e. Both diesel and petrol cars are the highest emitters per passenger-kilometre and account for 170-171 grams of CO2 per passenger kilometre (Table 13.5). The basis of these estimates is described in the environment section of the user guide.
Car emissions
2.18 Newly registered cars are becoming more fuel efficient and thus generally emit fewer emissions per kilometre. Figure 13.3 shows the steady downward trend in average CO2 emissions for newly registered cars in Scotland. Average CO2 emissions in Scotland for new car registrations has fallen by 10 per cent over the last ten years. However, since a low of 120 for CO2 in 2016 there has been a steady rise to 128.9 in 2020. (Table 13.6a)
2.19 The proportion of newly registered cars with emissions of 140g/km or lower has increased from 58 per cent in 2010 to 64 per cent in 2020. Cars with emissions of over 200g/km have decreased from 4.2 per cent of new cars to 4 per cent. These changes are at least in part the result of changes to vehicle excise duty bandings made by the UK Government in recent years.
Ultra low emission vehicles (ULEV)
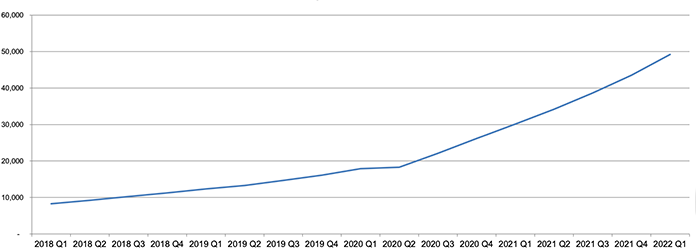
2.20 The number of ultra-low emission vehicles registered in Scotland for the first time so far in 2021 is 91% up on the corresponding figure in 2020 (January – September). Almost all of these sales have been supported by Plug-in-Grant scheme for cars and vans. At the end of Q3 2021 there are 38,634 ULEVs registered in Scotland (Table 13.7 and 13.8)
Registrations by type of vehicle
2.21 The overwhelming majority (98 per cent) of vehicles licensed for use on the roads in Scotland are still powered by either petrol or diesel. Historically petrol powered vehicles have been outsold by diesel vehicles although in recent years petrol vehicles have been outselling diesel. Overall though there are more petrol vehicles on the road than diesel ones. While 30 per cent of all diesel vehicles are body types other than cars only 6 per cent of petrol vehicles were not cars. (Table 13.9 and 13.10)
Electric Vehicle (EV) charge points
2.22 The shift to electric vehicles is an important part of responding to the climate emergency and improving air quality in our towns and cities. To help incentivise this shift, we have invested over £65 million in ChargePlace Scotland, Scotland's public charging network, which now has more than 2,400 publicly available charge points. Scotland is leading the way on electric vehicle charging infrastructure. The latest figures show that Scottish electric vehicle drivers benefit from over 60 public charge points per one hundred thousand people, compared to 53 in England (regional totals and London excluded), just under 40 in Wales and less than 20 in Northern Ireland.
2.23 A map showing the locations of the charging points in Scotland is available here https://chargeplacescotland.org/cpmap/ (Table 13.11)
| 1990 | 1995 | 1998 | 1999 | 2000 | 2001 | 2002 | 2003 | 2004 | 2005 | 2006 | 2007 | 2008 | 2009 | 2010 | 2011 | 2012 | 2013 | 2014 | 2015 | 2016 | 2017 | 2018 | 2019 | 2020 | ||||
|---|---|---|---|---|---|---|---|---|---|---|---|---|---|---|---|---|---|---|---|---|---|---|---|---|---|---|---|---|
| thousand tonnes of pollutant | ||||||||||||||||||||||||||||
| Oxides of nitrogen (NOx) | ||||||||||||||||||||||||||||
| Road transport | 105.6 | 85.9 | 72.2 | 67.3 | 61.2 | 58.3 | 55.5 | 52.9 | 50.5 | 48.4 | 47.5 | 46.1 | 43.5 | 35.8 | 33.9 | 31.8 | 30.7 | 29.7 | 28.8 | 27.7 | 26.6 | 26.0 | 24.6 | 23.6 | 16.6 | |||
| of which: | Buses and coaches | 6.4 | 6.3 | 6.0 | 5.9 | 5.5 | 5.4 | 5.4 | 5.4 | 4.8 | 4.7 | 4.7 | 4.8 | 4.3 | 4.2 | 4.1 | 3.6 | 3.2 | 3.1 | 2.7 | 2.3 | 1.8 | 1.7 | 1.2 | 1.2 | 1.1 | ||
| Passenger cars | 70.5 | 53.9 | 41.5 | 37.4 | 32.8 | 30.7 | 28.7 | 26.1 | 24.3 | 22.6 | 21.7 | 20.0 | 19.4 | 14.9 | 13.8 | 13.2 | 12.9 | 12.6 | 12.6 | 12.4 | 12.2 | 11.9 | 11.8 | 11.4 | 7.5 | |||
| of which: | Diesel | 0.9 | 2.7 | 3.6 | 3.9 | 4.2 | 4.6 | 5.2 | 5.7 | 6.4 | 7.1 | 7.6 | 7.9 | 8.5 | 8.6 | 8.7 | 9.0 | 9.5 | 10.0 | 10.3 | 10.5 | 10.5 | 10.5 | 10.5 | 10.1 | 6.6 | ||
| Petrol | 69.6 | 51.2 | 37.9 | 33.5 | 28.7 | 26.1 | 23.5 | 20.4 | 17.9 | 15.5 | 14.1 | 12.2 | 10.9 | 6.3 | 5.1 | 4.2 | 3.4 | 2.7 | 2.2 | 1.9 | 1.6 | 1.4 | 1.3 | 1.3 | 0.9 | |||
| HGVs | 19.4 | 17.3 | 16.5 | 16.2 | 15.6 | 15.2 | 14.8 | 14.9 | 15.0 | 14.8 | 14.9 | 15.2 | 13.9 | 11.2 | 10.5 | 9.3 | 8.3 | 7.1 | 5.9 | 4.7 | 3.6 | 2.8 | 2.4 | 2.0 | 2.2 | |||
| Light goods vehicles | 9.1 | 8.3 | 8.2 | 7.7 | 7.1 | 6.9 | 6.5 | 6.4 | 6.3 | 6.1 | 6.1 | 6.1 | 5.9 | 5.5 | 5.5 | 5.7 | 6.1 | 6.8 | 7.5 | 8.3 | 8.9 | 9.5 | 9.1 | 8.9 | 5.7 | |||
| of which: | Diesel | 1.7 | 3.1 | 4.1 | 4.4 | 4.6 | 4.8 | 4.9 | 5.2 | 5.3 | 5.5 | 5.5 | 5.6 | 5.5 | 5.3 | 5.3 | 5.6 | 6.0 | 6.7 | 7.5 | 8.2 | 8.9 | 9.5 | 9.1 | 8.9 | 5.6 | ||
| Petrol | 7.4 | 5.2 | 4.1 | 3.3 | 2.6 | 2.1 | 1.6 | 1.2 | 0.9 | 0.7 | 0.6 | 0.5 | 0.4 | 0.2 | 0.2 | 0.1 | 0.1 | 0.1 | 0.1 | 0.0 | 0.0 | 0.0 | 0.0 | 0.0 | 0.0 | |||
| Mopeds and motorcycles | 0.1 | 0.1 | 0.1 | 0.1 | 0.1 | 0.1 | 0.1 | 0.1 | 0.1 | 0.1 | 0.1 | 0.1 | 0.1 | 0.1 | 0.1 | 0.1 | 0.1 | 0.1 | 0.1 | 0.1 | 0.0 | 0.0 | 0.0 | 0.0 | 0.0 | |||
| Vehicles fuelled by Natural Gas7 | 0.0 | 0.0 | 0.0 | 0.0 | 0.0 | 0.0 | 0.0 | 0.0 | 0.0 | 0.0 | 0.0 | 0.0 | 0.0 | 0.0 | 0.0 | 0.0 | ||||||||||||
| Railways | 1.5 | 1.4 | 1.5 | 1.5 | 1.5 | 1.3 | 1.3 | 1.2 | 1.3 | 1.2 | 1.3 | 1.3 | 1.3 | 1.3 | 1.3 | 1.4 | 1.4 | 1.4 | 1.4 | 1.4 | 1.4 | 1.4 | 1.4 | 1.2 | 0.8 | |||
| Aviation | 0.7 | 0.7 | 0.9 | 1.0 | 0.9 | 1.0 | 0.9 | 1.0 | 1.1 | 1.2 | 1.2 | 1.2 | 1.1 | 1.0 | 0.9 | 1.0 | 1.0 | 1.0 | 1.0 | 1.1 | 1.0 | 1.1 | 1.1 | 1.0 | 0.3 | |||
| Shipping 6 | 38.7 | 45.4 | 42.3 | 42.0 | 38.4 | 34.4 | 36.7 | 35.6 | 35.0 | 36.1 | 31.3 | 32.3 | 30.5 | 28.8 | 27.2 | 24.0 | 23.5 | 22.1 | 22.8 | 22.6 | 22.7 | 25.1 | 21.7 | 20.6 | 29.1 | |||
| Other transport | 4.1 | 3.5 | 2.9 | 2.9 | 2.7 | 2.7 | 2.6 | 2.7 | 2.8 | 2.6 | 2.8 | 3.0 | 2.8 | 2.7 | 2.5 | 2.4 | 2.2 | 2.0 | 1.7 | 1.4 | 1.3 | 1.3 | 1.3 | 1.4 | 1.1 | |||
| Total Transport | 150.5 | 136.8 | 119.8 | 114.6 | 104.8 | 97.6 | 97.0 | 93.4 | 90.6 | 89.6 | 84.0 | 83.9 | 79.2 | 69.6 | 65.8 | 60.6 | 58.6 | 56.2 | 55.8 | 54.1 | 53.0 | 54.8 | 50.1 | 47.8 | 47.9 | |||
| Non-transport emissions | 187.0 | 144.2 | 127.0 | 119.0 | 122.0 | 119.3 | 108.1 | 101.6 | 99.9 | 91.1 | 99.8 | 90.7 | 79.8 | 70.6 | 72.5 | 62.0 | 62.7 | 59.9 | 56.3 | 53.7 | 43.2 | 40.9 | 39.7 | 36.7 | 34.1 | |||
| Emissions from all sources | 337.5 | 281.0 | 246.8 | 233.7 | 226.8 | 216.9 | 205.1 | 195.0 | 190.5 | 180.7 | 183.8 | 174.6 | 159.1 | 140.1 | 138.3 | 122.6 | 121.3 | 116.1 | 112.0 | 107.8 | 96.2 | 95.8 | 89.8 | 84.5 | 82.0 | |||
| Transport % of all NOx emissions | 45% | 49% | 49% | 49% | 46% | 45% | 47% | 48% | 48% | 50% | 46% | 48% | 50% | 50% | 48% | 49% | 48% | 48% | 50% | 50% | 55% | 57% | 56% | 57% | 58% | |||
| Particulate matter (PM10) | ||||||||||||||||||||||||||||
| Road transport2 | 3.01 | 3.45 | 3.33 | 3.27 | 2.89 | 2.82 | 2.74 | 2.70 | 2.64 | 2.59 | 2.56 | 2.51 | 2.40 | 2.31 | 2.24 | 2.08 | 2.00 | 1.92 | 1.85 | 1.79 | 1.74 | 1.75 | 1.70 | 1.69 | 1.38 | |||
| of which: | exhaust | Buses and coaches | 0.29 | 0.28 | 0.21 | 0.19 | 0.15 | 0.13 | 0.12 | 0.11 | 0.10 | 0.09 | 0.08 | 0.08 | 0.06 | 0.06 | 0.06 | 0.05 | 0.04 | 0.04 | 0.03 | 0.03 | 0.02 | 0.02 | 0.01 | 0.01 | 0.01 | |
| emissions | Passenger cars | 0.49 | 0.75 | 0.73 | 0.72 | 0.59 | 0.57 | 0.55 | 0.52 | 0.51 | 0.50 | 0.49 | 0.48 | 0.49 | 0.48 | 0.45 | 0.38 | 0.36 | 0.33 | 0.29 | 0.28 | 0.25 | 0.23 | 0.22 | 0.21 | 0.12 | ||
| from: | HGVs | 0.75 | 0.65 | 0.54 | 0.50 | 0.43 | 0.39 | 0.36 | 0.35 | 0.33 | 0.31 | 0.30 | 0.28 | 0.23 | 0.19 | 0.17 | 0.15 | 0.13 | 0.11 | 0.09 | 0.08 | 0.06 | 0.04 | 0.04 | 0.03 | 0.03 | ||
| Light goods vehicles | 0.49 | 0.73 | 0.75 | 0.74 | 0.61 | 0.60 | 0.56 | 0.54 | 0.51 | 0.49 | 0.45 | 0.42 | 0.38 | 0.36 | 0.36 | 0.31 | 0.28 | 0.24 | 0.21 | 0.18 | 0.16 | 0.14 | 0.12 | 0.10 | 0.05 | |||
| Mopeds and motorcycles | 0.01 | 0.01 | 0.01 | 0.01 | 0.01 | 0.01 | 0.01 | 0.01 | 0.01 | 0.01 | 0.01 | 0.01 | 0.00 | 0.00 | 0.00 | 0.00 | 0.00 | 0.00 | 0.00 | 0.00 | 0.00 | 0.00 | 0.00 | 0.00 | 0.00 | |||
| Vehicles fuelled by Natural Gas7 | 0.00 | 0.00 | 0.00 | 0.00 | 0.00 | 0.00 | 0.00 | 0.00 | 0.00 | 0.00 | 0.00 | 0.00 | 0.00 | 0.00 | 0.00 | 0.00 | ||||||||||||
| Road abrasion | 0.35 | 0.36 | 0.38 | 0.39 | 0.39 | 0.39 | 0.40 | 0.41 | 0.42 | 0.42 | 0.43 | 0.44 | 0.43 | 0.43 | 0.42 | 0.42 | 0.42 | 0.42 | 0.43 | 0.43 | 0.44 | 0.45 | 0.45 | 0.46 | 0.36 | |||
| Tyre and brake wear | 0.64 | 0.67 | 0.71 | 0.72 | 0.72 | 0.72 | 0.75 | 0.76 | 0.77 | 0.77 | 0.79 | 0.81 | 0.80 | 0.79 | 0.78 | 0.77 | 0.77 | 0.77 | 0.79 | 0.80 | 0.81 | 0.87 | 0.86 | 0.87 | 0.79 | |||
| Railways | 0.09 | 0.09 | 0.10 | 0.10 | 0.10 | 0.10 | 0.09 | 0.08 | 0.08 | 0.08 | 0.08 | 0.08 | 0.08 | 0.04 | 0.04 | 0.04 | 0.04 | 0.04 | 0.04 | 0.04 | 0.04 | 0.04 | 0.04 | 0.04 | 0.03 | |||
| Aviation3 | 0.01 | 0.01 | 0.01 | 0.01 | 0.01 | 0.01 | 0.01 | 0.01 | 0.01 | 0.01 | 0.01 | 0.01 | 0.01 | 0.01 | 0.01 | 0.01 | 0.01 | 0.01 | 0.01 | 0.01 | 0.01 | 0.01 | 0.01 | 0.01 | 0.01 | |||
| Shipping4,6 | 3.76 | 3.43 | 3.11 | 3.05 | 2.71 | 2.40 | 2.59 | 2.49 | 2.39 | 2.48 | 2.17 | 1.72 | 1.47 | 1.32 | 1.12 | 0.89 | 0.82 | 0.73 | 0.71 | 0.69 | 0.72 | 0.73 | 0.71 | 0.69 | 0.48 | |||
| Other transport5 | 0.17 | 0.15 | 0.14 | 0.14 | 0.13 | 0.13 | 0.13 | 0.13 | 0.14 | 0.13 | 0.13 | 0.13 | 0.12 | 0.11 | 0.10 | 0.09 | 0.08 | 0.07 | 0.06 | 0.05 | 0.04 | 0.03 | 0.03 | 0.03 | 0.02 | |||
| Total Transport | 7.04 | 7.13 | 6.70 | 6.57 | 5.85 | 5.47 | 5.57 | 5.42 | 5.26 | 5.29 | 4.96 | 4.45 | 4.08 | 3.78 | 3.51 | 3.12 | 2.96 | 2.77 | 2.67 | 2.58 | 2.55 | 2.57 | 2.50 | 2.46 | 1.92 | |||
| Non-transport emissions | 35.01 | 24.27 | 21.12 | 20.25 | 19.65 | 20.97 | 17.40 | 17.12 | 16.65 | 14.97 | 15.06 | 14.55 | 12.99 | 12.10 | 13.87 | 12.42 | 11.75 | 12.17 | 11.84 | 11.40 | 11.61 | 11.97 | 11.77 | 11.76 | 9.43 | |||
| Emissions from all sources | 42.05 | 31.40 | 27.82 | 26.83 | 25.50 | 26.43 | 22.97 | 22.53 | 21.91 | 20.27 | 20.02 | 19.00 | 17.07 | 15.88 | 17.38 | 15.54 | 14.71 | 14.93 | 14.51 | 13.98 | 14.16 | 14.54 | 14.27 | 14.22 | 11.34 | |||
| Transport % of all PM10 emissions | 17% | 23% | 24% | 25% | 23% | 21% | 24% | 24% | 24% | 26% | 25% | 23% | 24% | 24% | 20% | 20% | 20% | 19% | 18% | 18% | 18% | 18% | 18% | 17% | 17% | |||
| Particulate matter (PM2.5) | ||||||||||||||||||||||||||||
| Road transport2 | 2.56 | 2.98 | 2.83 | 2.77 | 2.39 | 2.31 | 2.22 | 2.17 | 2.11 | 2.05 | 2.00 | 1.94 | 1.85 | 1.76 | 1.70 | 1.54 | 1.47 | 1.38 | 1.30 | 1.24 | 1.18 | 1.15 | 1.11 | 1.09 | 0.85 | |||
| of which: | exhaust | Buses and coaches | 0.29 | 0.28 | 0.21 | 0.19 | 0.15 | 0.13 | 0.12 | 0.11 | 0.10 | 0.09 | 0.08 | 0.08 | 0.06 | 0.06 | 0.06 | 0.05 | 0.04 | 0.04 | 0.03 | 0.03 | 0.02 | 0.02 | 0.01 | 0.01 | 0.01 | |
| emissions | Passenger cars | 0.49 | 0.75 | 0.73 | 0.72 | 0.59 | 0.57 | 0.55 | 0.52 | 0.51 | 0.50 | 0.49 | 0.48 | 0.49 | 0.48 | 0.45 | 0.38 | 0.36 | 0.33 | 0.29 | 0.28 | 0.25 | 0.23 | 0.22 | 0.21 | 0.12 | ||
| from: | HGVs | 0.75 | 0.65 | 0.54 | 0.50 | 0.43 | 0.39 | 0.36 | 0.35 | 0.33 | 0.31 | 0.30 | 0.28 | 0.23 | 0.19 | 0.17 | 0.15 | 0.13 | 0.11 | 0.09 | 0.08 | 0.06 | 0.04 | 0.04 | 0.03 | 0.03 | ||
| Light goods vehicles | 0.49 | 0.73 | 0.75 | 0.74 | 0.61 | 0.60 | 0.56 | 0.54 | 0.51 | 0.49 | 0.45 | 0.42 | 0.38 | 0.36 | 0.36 | 0.31 | 0.28 | 0.24 | 0.21 | 0.18 | 0.16 | 0.14 | 0.12 | 0.10 | 0.05 | |||
| Mopeds and motorcycles | 0.01 | 0.01 | 0.01 | 0.01 | 0.01 | 0.01 | 0.01 | 0.01 | 0.01 | 0.01 | 0.01 | 0.01 | 0.00 | 0.00 | 0.00 | 0.00 | 0.00 | 0.00 | 0.00 | 0.00 | 0.00 | 0.00 | 0.00 | 0.00 | 0.00 | |||
| Vehicles fuelled by Natural Gas7 | 0.00 | 0.00 | 0.00 | 0.00 | 0.00 | 0.00 | 0.00 | 0.00 | 0.00 | 0.00 | 0.00 | 0.00 | 0.00 | 0.00 | 0.00 | 0.00 | ||||||||||||
| Road abrasion | 0.19 | 0.19 | 0.21 | 0.21 | 0.21 | 0.21 | 0.22 | 0.22 | 0.22 | 0.22 | 0.23 | 0.24 | 0.23 | 0.23 | 0.23 | 0.23 | 0.23 | 0.23 | 0.23 | 0.23 | 0.24 | 0.25 | 0.24 | 0.25 | 0.19 | |||
| Tyre and brake wear | 0.35 | 0.37 | 0.39 | 0.40 | 0.39 | 0.40 | 0.41 | 0.42 | 0.42 | 0.42 | 0.44 | 0.44 | 0.44 | 0.43 | 0.43 | 0.43 | 0.42 | 0.43 | 0.44 | 0.44 | 0.45 | 0.48 | 0.48 | 0.48 | 0.43 | |||
| Railways | 0.08 | 0.09 | 0.10 | 0.10 | 0.10 | 0.09 | 0.08 | 0.08 | 0.07 | 0.07 | 0.08 | 0.07 | 0.07 | 0.04 | 0.04 | 0.04 | 0.04 | 0.04 | 0.04 | 0.04 | 0.04 | 0.04 | 0.04 | 0.04 | 0.02 | |||
| Aviation3 | 0.01 | 0.01 | 0.01 | 0.01 | 0.01 | 0.01 | 0.01 | 0.01 | 0.01 | 0.01 | 0.01 | 0.01 | 0.01 | 0.01 | 0.01 | 0.01 | 0.01 | 0.01 | 0.01 | 0.01 | 0.01 | 0.01 | 0.01 | 0.01 | 0.00 | |||
| Shipping4,6 | 3.56 | 3.25 | 2.95 | 2.89 | 2.57 | 2.28 | 2.46 | 2.36 | 2.27 | 2.36 | 2.06 | 1.64 | 1.39 | 1.25 | 1.06 | 0.85 | 0.78 | 0.69 | 0.68 | 0.66 | 0.68 | 0.70 | 0.68 | 0.66 | 0.46 | |||
| Other transport5 | 0.17 | 0.15 | 0.14 | 0.14 | 0.13 | 0.13 | 0.13 | 0.13 | 0.13 | 0.13 | 0.13 | 0.13 | 0.12 | 0.11 | 0.10 | 0.09 | 0.08 | 0.07 | 0.06 | 0.04 | 0.04 | 0.03 | 0.03 | 0.03 | 0.02 | |||
| Total Transport | 6.38 | 6.48 | 6.03 | 5.90 | 5.20 | 4.83 | 4.91 | 4.75 | 4.59 | 4.62 | 4.28 | 3.79 | 3.44 | 3.16 | 2.90 | 2.53 | 2.37 | 2.19 | 2.08 | 1.99 | 1.94 | 1.93 | 1.87 | 1.82 | 1.36 | |||
| Non-transport emissions | 21.1 | 14.0 | 12.2 | 11.8 | 10.8 | 11.3 | 9.2 | 8.5 | 8.6 | 8.2 | 8.4 | 8.2 | 7.5 | 7.1 | 8.0 | 7.1 | 7.1 | 7.1 | 6.7 | 6.7 | 6.7 | 6.6 | 6.8 | 6.7 | 5.0 | |||
| Emissions from all sources | 27.5 | 20.5 | 18.3 | 17.7 | 16.0 | 16.1 | 14.1 | 13.3 | 13.2 | 12.8 | 12.6 | 12.0 | 11.0 | 10.3 | 10.9 | 9.6 | 9.5 | 9.3 | 8.8 | 8.7 | 8.6 | 8.6 | 8.6 | 8.6 | 6.4 | |||
| Transport % of all PM2.5 emissions | 23% | 32% | 33% | 33% | 32% | 30% | 35% | 36% | 35% | 36% | 34% | 32% | 31% | 31% | 27% | 26% | 25% | 24% | 24% | 23% | 23% | 23% | 22% | 21% | 21% | |||
Source: National Atmospheric Emissions Inventory - Not National Statistics
Emissions are available annually only with effect from 1998. The figures in this table are updated annually using the most recent data to reflect changes to the methodology used.
Emissions for 1990-2004 are taken from.
Air Quality Pollutant Inventories for England, Scotland, Wales and Northern Ireland: 1990 - 2018.
2.The Road Transport emissions database uses emission factors (g/km) for different types of vehicles, which depend on the fuel type (petrol or diesel) and are influenced by the
drive cycle or average speeds on the different types of roads; traffic activity for each DA region, including distance and average speed travelled by each type of vehicle on each type of road;
DA-specific fleet data on petrol/diesel car mix, car engine size and fleet composition (including age).
The sum of emissions across all parts of the UK equates to the total for the UK inventory where that total is normalised using fuel sales data of petrol and DERV.
3. Only take-off and landing emissions are reported.
4. Includes emissions from coastal shipping, shipping betweeen Scotland and the Overseas Territories, fishing vessels, marine engines, personal watercraft,
inland goods-carrying vehicles, motorboats and sail boats with auxiliary engines.
5. Includes military aviation and naval vessels, aircraft support vehicles and railways stationary combustion.
6. Data have been revised due to changes in methodology - see paragraphs 13.3.3 and 13.3.6 in notes and definitions.
7. This emissions category was included for the first time in the 2005-2020 report.
| Air Quality monitoring station 1 | Type of monitoring station | 2003 | 2004 | 2005 | 2006 | 2007 | 2008 | 2009 | 2010 | 2011 | 2012 | 2013 | 2014 | 2015 | 2016 | 2017 | 2018 | 2019 | 2020 | 2021 |
|---|---|---|---|---|---|---|---|---|---|---|---|---|---|---|---|---|---|---|---|---|
| Benzene 7 | micrograms per cubic metre | |||||||||||||||||||
| Edinburgh Med school | .. | .. | .. | .. | .. | .. | .. | .. | .. | .. | ||||||||||
| Nitrogen dioxide 2 | micrograms per cubic metre | |||||||||||||||||||
| Aberdeen Errol Place | Urban background | 31 | 26 | 24 | 27 | 24 | 25 | 26 | * | 23 | 21 | * | 22 | 23 | 21 | 22 | 20 | 17 | 14 | * |
| Aberdeen Union Street | Roadside | .. | .. | 64 | 49 | 53 | 55 | * | 59 | 44 | 53 | 48 | 47 | 46 | 43 | 40 | 38 | 36 | 24 | 25 |
| Bishopbriggs, Kirkintilloch Road | Roadside | * | 35 | * | 33 | 32 | 33 | 33 | 33 | * | 30 | 31 | 29 | 27 | 29 | 27 | 27 | 26 | 20 | * |
| Dumfries, A780 | Roadside | 38 | 37 | 36 | 37 | 38 | 37 | 35 | 40 | 32 | 33 | 30 | 30 | 30 | 31 | 30 | 30 | 31 | 22 | 22 |
| Dundee Lochee Road | Roadside | .. | .. | .. | * | 53 | 53 | 54 | 55 | * | 53 | 52 | 46 | 48 | 45 | 44 | 43 | 43 | 31 | 32 |
| Dundee Union Street | Kerbside | .. | .. | .. | * | 36 | 43 | 45 | 40 | 36 | 32 | 31 | 29 | 28 | 10 | .. | .. | .. | .. | .. |
| Eskdalemuir | Rural | .. | .. | 4 | 4 | 5 | 5 | 4 | 3 | 3 | 3 | 3 | 2 | 2 | 2 | 2 | 2 | 2 | 2 | .. |
| Edinburgh Gorgie Road | Roadside | .. | .. | 34 | .. | 41 | 42 | 38 | 41 | 37 | 39 | 38 | 34 | 32 | 33 | 30 | 28 | 27 | 18 | 18 |
| Edinburgh St Leonards | Urban background | .. | 25 | 25 | 27 | 27 | 31 | 24 | 31 | 25 | 24 | 22 | * | * | 20 | 20 | 18 | 21 | 14 | 14 |
| Glasgow Centre, St Enoch's Square | Urban centre | * | 36 | 33 | 31 | 31 | 35 | 42 | 44 | 34 | * | .. | .. | .. | .. | .. | .. | .. | .. | * |
| Glasgow Kerbside, Hope Street | Kerbside | 75 | 68 | 62 | 68 | 70 | 82 | 78 | 84 | 72 | 72 | 67 | 68 | 60 | 65 | 59 | 61 | 56 | 36 | .. |
| Glasgow Byres Road | Roadside | .. | .. | 38 | 41 | 40 | 43 | 40 | 47 | * | 39 | 44 | * | 38 | 38 | 37 | 34 | 35 | 23 | 26 |
| Glasgow City Chambers | Urban background | 50 | 49 | 46 | 47 | 47 | 48 | 46 | 49 | * | .. | .. | .. | .. | .. | .. | .. | .. | .. | .. |
| Inverness, Telford Street | Roadside | 23 | 23 | 21 | 21 | 22 | 21 | 21 | 24 | 27 | 29 | 21 | 21 | * | 24 | 20 | 18 | 17 | 13 | 14 |
| Perth High Street | Roadside | * | 28 | 28 | 28 | 29 | 27 | 25 | 30 | 27 | 26 | 22 | 22 | 22 | 23 | 22 | 21 | 25 | 15 | * |
| Ozone 3 | ||||||||||||||||||||
| Edinburgh St Leonards | Urban background | .. | 53 | 53 | 52 | 48 | 49 | 52 | 33 | 40 | 49 | 49 | * | 45 | 45 | 46 | 51 | 48 | 55 | 53 |
| Eskdalemuir | Rural | 51 | 53 | 51 | 58 | 54 | 57 | 56 | 55 | 53 | 51 | 60 | 58 | 57 | 54 | 57 | 58 | 60 | 58 | * |
| Strath Vaich | Rural | 73 | 76 | 67 | 72 | 68 | 73 | 67 | 61 | 64 | 67 | 70 | 69 | 70 | 68 | 68 | 66 | 68 | 65 | 67 |
| Number of daily maximums (measured as an 8-hour running mean) exceeding 100ug/m3 | ||||||||||||||||||||
| Edinburgh St Leonards | Urban background | .. | 12 | 13 | 16 | 9 | 14 | 3 | 0 | 0 | 4 | 2 | * | 3 | 3 | 2 | 13 | 5 | 5 | 0 |
| Eskdalemuir | Rural | 18 | 5 | 1 | 23 | 11 | 16 | 20 | 2 | 10 | 7 | 14 | 7 | 9 | 8 | 3 | 16 | 16 | 2 | * |
| Strath Vaich | Rural | 48 | 29 | 18 | 47 | 17 | 65 | 4 | 4 | 14 | 12 | 23 | 17 | 10 | 10 | 6 | 12 | 26 | 1 | 5 |
| Particulates (PM10) 4 | micrograms per cubic metre | |||||||||||||||||||
| Aberdeen Errol Place | Urban background | 22 | 19 | 19 | 20 | 17 | 16 | 15 | 13 | 14 | 12 | 13 | 15 | 12 | 12 | 11 | 14 | 14 | 9 | * |
| Aberdeen Union Street | Roadside | .. | .. | 25 | 26 | 19 | 22 | 18 | 18 | 22 | 21 | 20 | 18 | * | 13 | 13 | 15 | 11 | * | * |
| Bishopbriggs, Kirkintilloch Road | Roadside | .. | .. | 25 | 22 | 22 | 17 | 19 | 19 | 17 | 15 | * | * | * | 15 | 16 | 17 | 12 | 10 | 10 |
| Dundee Broughty Ferry | Roadside | .. | .. | .. | 20 | 18 | 15 | 15 | 16 | 16 | 14 | 16 | 15 | 13 | 12 | 11 | 12 | 14 | 9 | 10 |
| Dundee Union Street | Kerbside | .. | .. | .. | 24 | 22 | 17 | 17 | 17 | 19 | 16 | 15 | 16 | 17 | .. | .. | .. | .. | .. | .. |
| Edinburgh Queen Street | Roadside | .. | .. | .. | .. | 26 | 18 | 17 | 18 | 16 | 16 | 17 | 17 | 15 | * | .. | .. | .. | .. | .. |
| Edinburgh St Leonards | Urban background | .. | 19 | 18 | 20 | 19 | 15 | * | 14 | 15 | * | 14 | * | 10 | 11 | 10 | 11 | 11 | 8 | 9 |
| Glasgow Byres Road | Roadside | .. | .. | 27 | 27 | 25 | 10 | 19 | 23 | * | 13 | * | * | 10 | 12 | 13 | 14 | 15 | 11 | 6 |
| Glasgow Waulkmillglen Reservoir | Rural | .. | .. | 14 | 15 | 15 | 12 | 11 | 12 | 12 | 11 | 12 | * | 11 | * | 11 | 9 | 9 | 7 | 4 |
| Glasgow Kerbside, Hope Street | Kerbside | 32 | 27 | 29 | 38 | 32 | 27 | 26 | 29 | * | * | 23 | .. | .. | .. | .. | .. | .. | .. | .. |
| Glasgow Centre, St Enoch's Square | Urban centre | 21 | * | 20 | 21 | 20 | 19 | 25 | * | 17 | * | .. | .. | .. | .. | .. | .. | .. | .. | .. |
| Inverness, Telford Street | Roadside | 15 | 14 | 15 | 16 | 14 | 12 | 12 | 14 | 12 | 11 | 12 | 11 | 9 | 9 | .. | .. | 9 | 8 | 9 |
| Perth High Street | Roadside | * | 17 | 19 | 21 | 20 | 16 | 16 | 19 | 19 | 15 | 16 | 14 | 13 | 13 | 13 | .. | .. | .. | .. |
| Particulates (PM2.5) 5 | micrograms per cubic metre | |||||||||||||||||||
| Aberdeen Errol Place | Urban background | 22 | 19 | 19 | 20 | .. | .. | .. | 7 | 8 | 9 | 9 | 10 | 8 | 5 | 6 | 7 | 7 | 5 | * |
| Aberdeen Union Street | Roadside | .. | .. | 25 | 26 | .. | .. | .. | .. | .. | .. | .. | * | 11 | 7 | 7 | 8 | 7 | * | * |
| Auchencorth Moss | Rural | .. | .. | 25 | 22 | 4 | 3 | 3 | .. | 4 | 4 | .. | 7 | 3 | 3 | 5 | 5 | 4 | 3 | 4 |
| Edinburgh St Leonards | Urban background | .. | 19 | 18 | 20 | .. | .. | 8 | 9 | 12 | .. | 8 | .. | 6 | 6 | 7 | 6 | 6 | 4 | 5 |
| Glasgow Kerbside, Hope Street | Kerbside | 32 | 27 | 29 | 38 | .. | .. | .. | 23 | 22 | 20 | 16 | .. | .. | .. | .. | .. | .. | .. | .. |
| Glasgow Centre, St Enoch's Square | Urban centre | 21 | * | 20 | 21 | .. | .. | 12 | 12 | 10 | .. | .. | .. | .. | .. | .. | .. | .. | .. | .. |
| Glasgow High Street | Roadside | 15 | 14 | 15 | 16 | .. | .. | .. | .. | .. | .. | .. | .. | 8 | 8 | 7 | 7 | 6 | 5 | 6 |
| Glasgow Townhead | Urban background | * | 17 | 19 | 21 | .. | .. | .. | .. | .. | .. | .. | 7 | 7 | 7 | 8 | 7 | 7 | 5 | 5 |
| Grangemouth | Urban industrial | .. | .. | 9 | 11 | 11 | 11 | .. | 8 | 9 | 6 | 6 | 7 | 8 | 6 | 5 | ||||
Source: Scottish Government - Not National Statistics
1. The sites chosen are a mixture of urban and rural site types with long time series
2. Annual mean concentration of atmospheric nitrogen dioxide.
3. Annual mean ground level ozone concentration.
4. Annual mean atmospheric PM10 concentration.
5. Annual mean atmospheric PM2.5 concentration.
(*) Since 2003, results where data capture is less than 75% are not shown.
(..) Site not in operation for given year
(a) those to which transport is understood to contribute significantly - see text.
| Local authority | Pollutant(s) | All pollutants | |||
|---|---|---|---|---|---|
| Nitrogen dioxide (NO2) only | Particulate Matter (PM10) only | Both NO2 and PM10 | Sulphur dioxide | ||
| Aberdeen City Council | - | - | 3 | - | 3 |
| City of Edinburgh Council | 5 | 1 | - | - | 6 |
| Dundee City Council | - | - | 1 | - | 1 |
| East Dunbartonshire Council | - | - | 2 | - | 2 |
| East Lothian Council | 1 | - | - | - | 1 |
| Falkirk Council | 1 | - | 1 | 1 | 3 |
| Fife Council | - | - | 2 | - | 2 |
| Glasgow City Council | - | - | 2 | - | 2 |
| Highland Council | 1 | - | - | - | 1 |
| North Lanarkshire Council | - | 6 | - | - | 6 |
| Perth & Kinross Council | - | - | 2 | - | 2 |
| Renfrewshire Council | 2 | - | 1 | - | 3 |
| South Lanarkshire Council | 1 | 2 | - | - | 3 |
| West Lothian Council | - | 1 | 2 | - | 3 |
| Scotland | 11 | 10 | 16 | 1 | 38 |
Source: Scottish Air Quality website - Not National Statistics
Figure 13.1: Index of air pollutant emissions from transport in Scotland, 1990-2020 (1990=100) 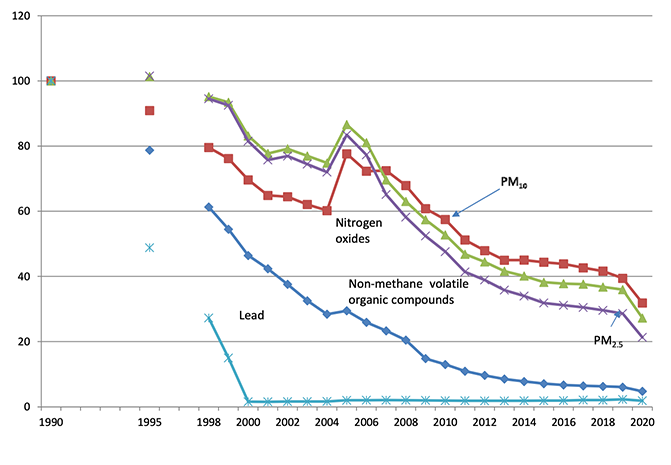
| Year | 2009 | 2010 | 2011 | 2012 | 2013 | 2014 | 2015 | 2016 | 2017 | 2018 | 2019 | 2020 |
|---|---|---|---|---|---|---|---|---|---|---|---|---|
| Buses & coaches | 0.53 | 0.54 | 0.50 | 0.48 | 0.49 | 0.48 | 0.46 | 0.45 | 0.46 | 0.39 | 0.43 | 0.33 |
| Passenger cars | 5.95 | 5.71 | 5.60 | 5.59 | 5.48 | 5.47 | 5.48 | 5.55 | 5.64 | 5.52 | 5.37 | 3.94 |
| Heavy Goods Vehicles | 1.76 | 1.79 | 1.72 | 1.74 | 1.73 | 1.71 | 1.74 | 1.81 | 1.86 | 1.82 | 1.74 | 1.52 |
| Light Goods Vehicles | 1.26 | 1.28 | 1.28 | 1.29 | 1.31 | 1.37 | 1.44 | 1.56 | 1.67 | 1.64 | 1.57 | 1.39 |
| Mopeds & motorcycles | 0.04 | 0.03 | 0.03 | 0.03 | 0.03 | 0.03 | 0.03 | 0.03 | 0.03 | 0.03 | 0.03 | 0.02 |
| Other road2 | 0.06 | 0.06 | 0.06 | 0.06 | 0.06 | 0.06 | 0.05 | 0.05 | 0.05 | 0.06 | 0.07 | 0.07 |
| Road Transportation Total1 | 9.60 | 9.42 | 9.20 | 9.20 | 9.10 | 9.13 | 9.22 | 9.45 | 9.72 | 9.46 | 9.21 | 7.28 |
| Railways | 0.17 | 0.17 | 0.16 | 0.17 | 0.17 | 0.17 | 0.17 | 0.17 | 0.17 | 0.16 | 0.16 | 0.12 |
| International Aviation and Shipping3 | 1.64 | 1.44 | 1.57 | 1.47 | 1.54 | 1.66 | 1.73 | 1.82 | 1.93 | 1.90 | 1.91 | 0.81 |
| Domestic Aviation3 | 0.84 | 0.78 | 0.77 | 0.74 | 0.75 | 0.72 | 0.70 | 0.65 | 0.69 | 0.66 | 0.63 | 0.35 |
| Domestic Shipping and Maritime3 | 2.70 | 2.54 | 2.16 | 1.94 | 1.79 | 1.86 | 1.98 | 2.06 | 1.97 | 2.06 | 2.04 | 1.78 |
| Total transport | 14.95 | 14.35 | 13.86 | 13.52 | 13.35 | 13.54 | 13.79 | 14.15 | 14.47 | 14.23 | 13.95 | 10.34 |
| Non-transport net emissions | 46.25 | 49.54 | 42.90 | 43.48 | 41.71 | 37.92 | 37.06 | 32.07 | 30.80 | 32.22 | 31.45 | 29.62 |
| Net emissions all sources4 | 61.20 | 63.90 | 56.75 | 57.00 | 55.06 | 51.45 | 50.85 | 46.22 | 45.26 | 46.45 | 45.40 | 39.95 |
| Total net emissions attributed to transport (%)4 | 24.43 | 22.46 | 24.41 | 23.72 | 24.25 | 26.31 | 27.13 | 30.60 | 31.96 | 30.64 | 30.73 | 25.87 |
| Year | 1990 | 1995 | 1998 | 1999 | 2000 | 2001 | 2002 | 2003 | 2004 | 2005 | 2006 | 2007 | 2008 |
|---|---|---|---|---|---|---|---|---|---|---|---|---|---|
| Buses & coaches | 0.59 | 0.60 | 0.60 | 0.59 | 0.55 | 0.55 | 0.57 | 0.58 | 0.53 | 0.53 | 0.54 | 0.57 | 0.52 |
| Passenger cars | 5.75 | 5.79 | 5.99 | 6.07 | 6.04 | 6.03 | 6.24 | 6.16 | 6.21 | 6.20 | 6.26 | 6.29 | 6.12 |
| Heavy Goods Vehicles | 1.86 | 1.81 | 1.83 | 1.79 | 1.74 | 1.72 | 1.73 | 1.80 | 1.85 | 1.91 | 1.96 | 2.01 | 1.89 |
| Light Goods Vehicles | 0.93 | 1.00 | 1.14 | 1.14 | 1.10 | 1.09 | 1.12 | 1.15 | 1.18 | 1.22 | 1.27 | 1.33 | 1.27 |
| Mopeds & motorcycles | 0.04 | 0.03 | 0.03 | 0.03 | 0.03 | 0.03 | 0.04 | 0.04 | 0.04 | 0.04 | 0.04 | 0.04 | 0.04 |
| Other road2 | 0.02 | 0.02 | 0.02 | 0.02 | 0.02 | 0.03 | 0.04 | 0.05 | 0.05 | 0.06 | 0.06 | 0.06 | 0.07 |
| Road Transportation Total1 | 9.18 | 9.25 | 9.61 | 9.63 | 9.50 | 9.46 | 9.74 | 9.79 | 9.86 | 9.97 | 10.13 | 10.30 | 9.92 |
| Railways | 0.12 | 0.13 | 0.14 | 0.14 | 0.14 | 0.15 | 0.15 | 0.15 | 0.15 | 0.15 | 0.16 | 0.17 | 0.17 |
| International Aviation and Shipping3 | 1.32 | 1.46 | 1.77 | 1.60 | 1.44 | 1.57 | 1.40 | 1.34 | 1.52 | 1.62 | 1.70 | 1.75 | 1.79 |
| Domestic Aviation3 | 0.85 | 0.74 | 0.82 | 0.85 | 0.85 | 0.88 | 0.91 | 0.93 | 0.94 | 1.00 | 1.03 | 1.03 | 0.95 |
| Domestic Shipping and Maritime3 | 3.43 | 4.26 | 4.21 | 4.26 | 3.84 | 3.54 | 3.74 | 3.51 | 3.32 | 3.24 | 2.92 | 3.02 | 2.82 |
| Total transport | 14.90 | 15.84 | 16.55 | 16.48 | 15.77 | 15.59 | 15.95 | 15.71 | 15.80 | 15.99 | 15.94 | 16.26 | 15.65 |
| Non-transport net emissions | 66.66 | 64.46 | 64.21 | 61.41 | 63.85 | 62.75 | 58.28 | 58.62 | 55.99 | 54.07 | 56.21 | 51.72 | 49.81 |
| Net emissions all sources4 | 81.56 | 80.30 | 80.76 | 77.89 | 79.63 | 78.34 | 74.23 | 74.33 | 71.79 | 70.06 | 72.16 | 67.99 | 65.46 |
| Total net emissions attributed to transport (%)4 | 18.27 | 19.73 | 20.49 | 21.16 | 19.81 | 19.90 | 21.48 | 21.14 | 22.01 | 22.82 | 22.10 | 23.92 | 23.90 |
Source: National Atmospheric Emissions Inventory: Greenhouse Gas Inventories for England, Scotland, Wales & Northern Ireland 1990-2020, some headings are own aggregations - Not National Statistics
1. The method used to estimate carbon dioxide (CO2) emissions from road transport is based on vehicle kilometre travelled data constrained so that the sum of emissions across all parts of the UK equates to the total for the UK inventory.
That total is derived from fuel sales data of petrol and DERV within the UK as specified in the reporting guidelines of the Intergovernmental Panel on Climate Change. Further detail can be found in Section 3.3 of the report and in Annex 2.
2. Other road includes urea used as part of an additive for certain categories of diesel engine, LPG use and road vehicle engines.
3. Includes various additional emissions associated with both shipping and aviation such as support vehicles at airports or marine engines on ships
4. Net emissions take account of removals of carbon dioxide due to carbon sinks.
| Year | 1990 | 1995 | 1998 | 1999 | 2000 | 2001 | 2002 | 2003 | 2004 | 2005 | 2006 | 2007 | 2008 | 2009 | 2010 | 2011 | 2012 | 2013 | 2014 | 2015 | 2016 | 2017 | 2018 | 2019 | 2020 |
|---|---|---|---|---|---|---|---|---|---|---|---|---|---|---|---|---|---|---|---|---|---|---|---|---|---|
| Non-IAS Emissions | |||||||||||||||||||||||||
| Carbon dioxide (CO2) | 13.320 | 14.091 | 14.521 | 14.625 | 14.087 | 13.802 | 14.320 | 14.160 | 14.082 | 14.173 | 14.064 | 14.338 | 13.709 | 13.174 | 12.778 | 12.166 | 11.928 | 11.689 | 11.753 | 11.941 | 12.198 | 12.403 | 12.196 | 11.913 | 9.423 |
| Methane (CH4) | 0.101 | 0.080 | 0.065 | 0.060 | 0.054 | 0.048 | 0.044 | 0.039 | 0.035 | 0.032 | 0.030 | 0.027 | 0.024 | 0.018 | 0.016 | 0.014 | 0.012 | 0.011 | 0.010 | 0.009 | 0.008 | 0.009 | 0.008 | 0.008 | 0.006 |
| Nitrous Oxide (N2O) | 0.164 | 0.206 | 0.195 | 0.197 | 0.189 | 0.179 | 0.180 | 0.170 | 0.162 | 0.156 | 0.146 | 0.144 | 0.123 | 0.116 | 0.114 | 0.110 | 0.109 | 0.110 | 0.114 | 0.117 | 0.121 | 0.125 | 0.125 | 0.123 | 0.100 |
| Total transport greenhouse gases (Excluding International Aviation and Shipping) | 13.585 | 14.376 | 14.781 | 14.881 | 14.330 | 14.029 | 14.544 | 14.369 | 14.280 | 14.361 | 14.240 | 14.509 | 13.857 | 13.308 | 12.908 | 12.289 | 12.050 | 11.810 | 11.876 | 12.067 | 12.328 | 12.537 | 12.330 | 12.043 | 9.529 |
| IAS Emissions | |||||||||||||||||||||||||
| Carbon dioxide (CO2) | 1.299 | 1.446 | 1.744 | 1.579 | 1.428 | 1.547 | 1.388 | 1.327 | 1.500 | 1.607 | 1.685 | 1.735 | 1.770 | 1.625 | 1.429 | 1.550 | 1.458 | 1.528 | 1.642 | 1.709 | 1.798 | 1.910 | 1.884 | 1.888 | 0.798 |
| Methane (CH4) | 0.001 | 0.001 | 0.001 | 0.000 | 0.000 | 0.000 | 0.000 | 0.000 | 0.000 | 0.000 | 0.000 | 0.000 | 0.000 | 0.000 | 0.000 | 0.000 | 0.000 | 0.000 | 0.000 | 0.000 | 0.000 | 0.000 | 0.000 | 0.000 | 0.000 |
| Nitrous Oxide (N2O) | 0.016 | 0.017 | 0.020 | 0.018 | 0.016 | 0.018 | 0.016 | 0.014 | 0.016 | 0.017 | 0.018 | 0.018 | 0.020 | 0.018 | 0.015 | 0.017 | 0.015 | 0.016 | 0.017 | 0.018 | 0.019 | 0.019 | 0.019 | 0.019 | 0.009 |
| Total greenhouse gases from International Aviation and Shipping | 1.315 | 1.464 | 1.765 | 1.597 | 1.444 | 1.565 | 1.404 | 1.341 | 1.517 | 1.625 | 1.704 | 1.754 | 1.790 | 1.643 | 1.444 | 1.567 | 1.474 | 1.544 | 1.660 | 1.727 | 1.817 | 1.930 | 1.903 | 1.908 | 0.806 |
| All transport greenhouse gases | 14.900 | 15.840 | 16.547 | 16.478 | 15.774 | 15.594 | 15.948 | 15.711 | 15.797 | 15.986 | 15.944 | 16.264 | 15.646 | 14.951 | 14.352 | 13.856 | 13.524 | 13.354 | 13.536 | 13.793 | 14.145 | 14.467 | 14.233 | 13.951 | 10.336 |
Source: Scottish Greenhouse Gas Statistics 2020 - Not National Statistics
Supporting documents - Scottish Greenhouse Gas Statistics 2020 - gov.scot (www.gov.scot)
1. The footnotes to Table 5.12 also apply to this table, including revision of the figures; though note that emissions of methane and nitrous oxide from road transport are estimated using vehicle kilometre data. In both of the calculation methods, and the total emissions of these GHGs from the two methods are identical. There are no emissions of other greenhouse gases by transport in the inventory.
2. The figures for greenhouse gas emissions are expressed in terms of their Global Warming Potential in tonnes of carbon dioxide equivalent. To convert from tonnes of carbon dioxide equivalent to tonnes of other gases multiply by the following factors: GWP methane - 25, GWP nitrous oxide - 298.
| Scottish Baseline (1990) | UK Baseline (1990) | Scottish Emissions (2019) | UK Emissions (2019) | Scottish Emissions (2020) | UK Emissions (2020) | Scottish Emissions as % of UK Emissions (2019) | Change in Scottish Emissions (2018-2019) | Change in UK Emissions (2018-2019) | Change in Scottish Emissions (1990-2019) | Change in UK Emissions (1990-2019) | |
|---|---|---|---|---|---|---|---|---|---|---|---|
| Buses & coaches | 0.59 | 5.20 | 0.43 | 3.10 | 0.33 | 2.10 | 16% | -23% | -32% | -44% | -60% |
| Passenger cars | 5.75 | 71.91 | 5.37 | 68.88 | 3.94 | 51.77 | 8% | -27% | -25% | -31% | -28% |
| Heavy Goods Vehicles | 1.86 | 21.15 | 1.74 | 19.68 | 1.52 | 18.59 | 8% | -13% | -6% | -18% | -12% |
| Light Goods Vehicles | 0.93 | 11.39 | 1.57 | 17.74 | 1.39 | 15.97 | 9% | -11% | -10% | 50% | 40% |
| Mopeds & motorcycles | 0.04 | 0.77 | 0.03 | 0.53 | 0.02 | 0.43 | 6% | -25% | -19% | -38% | -44% |
| Other Road | 0.02 | 0.17 | 0.07 | 0.74 | 0.07 | 0.69 | 9% | -4% | -7% | 226% | 305% |
| Road Transportation Total | 9.19 | 110.59 | 9.21 | 110.67 | 7.28 | 89.55 | 8% | -21% | -19% | -21% | -19% |
| Emissions by Road Type | |||||||||||
| Urban | 3.50 | 50.45 | 3.28 | 42.50 | 2.63 | 34.55 | 8% | -20% | -19% | -25% | -32% |
| Rural | 4.60 | 41.64 | 4.09 | 43.60 | 3.21 | 35.01 | 9% | -22% | -20% | -30% | -16% |
| Motorway | 1.05 | 18.15 | 1.76 | 23.67 | 1.37 | 19.18 | 7% | -21% | -19% | 31% | 6% |
| Railways | 0.12 | 1.96 | 0.16 | 1.85 | 0.12 | 1.44 | 9% | -23% | -22% | 3% | -26% |
| International Aviation and Shipping 1 | 1.32 | 23.67 | 1.91 | 44.16 | 0.81 | 20.53 | 4% | -58% | -54% | -39% | -13% |
| Domestic Aviation 2 | 0.85 | 5.65 | 0.63 | 3.17 | 0.35 | 2.15 | 16% | -44% | -32% | -59% | -62% |
| Domestic Shipping and Maritime 3 | 3.43 | 9.93 | 2.04 | 6.60 | 1.78 | 5.65 | 31% | -13% | -14% | -48% | -43% |
| Total transport (excl International Aviation and Shipping) | 13.59 | 128.13 | 12.04 | 122.30 | 9.53 | 98.80 | 10% | -21% | -19% | -30% | -23% |
| Total transport (incl International Aviation and Shipping) | 14.91 | 151.80 | 13.95 | 166.45 | 10.34 | 119.33 | 9% | -26% | -28% | -31% | -21% |
Source: National Atmospheric Emissions Inventory: Greenhouse Gas Inventories for England, Scotland, Wales & Northern Ireland 1990-2019, some headings are own aggregations - Not National Statistics
https://naei.beis.gov.uk/reports/reports?report_
1. Includes aircraft engine emissions
2 . Includes military aircraft and aircraft upport vehicls
3. Includes lubricant for marine engines
Figure 13.2: Estimated greenhouse gas emissions of Scottish transport for 2020 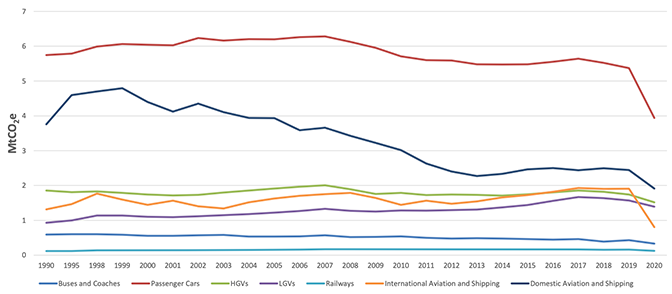
| Mode of Transport | gCO2e per passenger kilometre |
|---|---|
| Petrol cars2 | 170 |
| Diesel cars2 | 171 |
| Hybrid2 | 120 |
| Petrol motorbike | 114 |
| g CO2e per passenger km | |
| Bus | 97 |
| Coach | 27 |
| National rail | 35 |
| Light rail and tram | 29 |
| Ferry | 113 |
| Domestic flights3,4 | 130 |
| Short haul international3,4 | 81 |
| Long haul international3,4 | 102 |
1. Source https://www.gov.uk/government/publications/greenhouse-gas-reporting-conversion-factors-2022
https://naei.beis.gov.uk/reports/reports?section_
All figures are estimated using data for GB/UK as a whole so do not specifically relate to Scotland.
2. The long haul estimate is based on a flight length from the Guidelines of of 6482 km, short haul 1108km and domestic 463km.
3. Aviation emissions calculations not inclusive of radiative forcing.
| 2011 | 2012 | 2013 | 2014 | 2015 | 2016 | 2017 | 2018 | 2019 | 2020 | 2021 | |
|---|---|---|---|---|---|---|---|---|---|---|---|
| thousands | |||||||||||
| Up to 100 g/km | 4.6 | 13.0 | 25.6 | 36.2 | 39.1 | 36.4 | 32.3 | 22.9 | 17.4 | 17.0 | 19.3 |
| 101 - 110 g/km | 15.3 | 17.3 | 23.5 | 34.8 | 46.9 | 52.6 | 43.6 | 32.6 | 24.1 | 8.2 | 6.8 |
| 111 - 120 g/km | 28.1 | 31.6 | 43.1 | 48.2 | 41.2 | 48.3 | 47.4 | 44.6 | 37.9 | 16.1 | 21.3 |
| 121 - 130 g/km | 28.5 | 39.4 | 39.7 | 36.5 | 33.3 | 32.1 | 29.8 | 29.3 | 33.6 | 21.8 | 23.9 |
| 131 - 140 g/km | 31.4 | 30.5 | 26.3 | 23.8 | 23.7 | 20.1 | 21.1 | 20.0 | 18.4 | 18.4 | 19.9 |
| 141 - 150 g/km | 20.3 | 18.9 | 17.0 | 13.8 | 12.7 | 12.5 | 11.3 | 13.3 | 16.2 | 14.2 | 13.7 |
| 151 - 165 g/km | 18.1 | 14.1 | 14.1 | 15.3 | 13.2 | 10.1 | 9.2 | 12.3 | 15.8 | 12.8 | 12.8 |
| 166 - 175 g/km | 6.1 | 5.7 | 6.4 | 4.4 | 4.1 | 3.5 | 3.2 | 4.3 | 5.3 | 4.9 | 7.8 |
| 176- 185 g/km | 5.4 | 3.5 | 2.5 | 2.6 | 3.0 | 2.2 | 2.2 | 3.2 | 3.0 | 4.6 | 3.5 |
| 186- 200 g/km | 4.6 | 3.9 | 2.8 | 2.9 | 1.3 | 1.0 | 1.5 | 1.9 | 1.6 | 3.8 | 2.6 |
| 201 - 225 g/km | 1.8 | 1.5 | 1.5 | 1.8 | 1.6 | 1.5 | 0.8 | 1.3 | 2.4 | 2.1 | 2.4 |
| 226 - 255 g/km | 2.3 | 1.8 | 1.4 | 1.0 | 0.6 | 0.4 | 0.3 | 0.4 | 0.7 | 2.0 | 2.1 |
| Over 255 g/km | 0.6 | 0.5 | 0.5 | 0.5 | 0.4 | 0.6 | 0.5 | 0.6 | 0.7 | 1.0 | 1.1 |
| Not known | 0.5 | 0.7 | 0.7 | 0.6 | 0.7 | 0.8 | 0.7 | 0.8 | 0.8 | 0.8 | 1.4 |
| Total | 167.8 | 182.5 | 205.2 | 222.4 | 221.8 | 222.1 | 204.0 | 187.5 | 177.7 | 127.7 | 138.4 |
| Avg CO2 | 138.2 | 133.2 | 128.4 | 124.4 | 121.4 | 120.0 | 120.2 | 123.6 | 126.5 | 128.9 | 124.7 |
| Column Percentages | |||||||||||
| Up to 100 g/km | 2.7 | 7.1 | 12.5 | 16.3 | 17.6 | 16.4 | 15.8 | 12.2 | 9.8 | 13.3 | 13.9 |
| 101 - 110 g/km | 9.1 | 9.5 | 11.4 | 15.7 | 21.2 | 23.7 | 21.4 | 17.4 | 13.5 | 6.4 | 4.9 |
| 111 - 120 g/km | 16.8 | 17.3 | 21.0 | 21.7 | 18.6 | 21.7 | 23.2 | 23.8 | 21.3 | 12.6 | 15.4 |
| 121 - 130 g/km | 17.0 | 21.6 | 19.4 | 16.4 | 15.0 | 14.5 | 14.6 | 15.6 | 18.9 | 17.0 | 17.3 |
| 131 - 140 g/km | 18.7 | 16.7 | 12.8 | 10.7 | 10.7 | 9.1 | 10.4 | 10.6 | 10.3 | 14.4 | 14.4 |
| 141 - 150 g/km | 12.1 | 10.4 | 8.3 | 6.2 | 5.7 | 5.6 | 5.6 | 7.1 | 9.1 | 11.1 | 9.9 |
| 151 - 165 g/km | 10.8 | 7.8 | 6.9 | 6.9 | 5.9 | 4.6 | 4.5 | 6.5 | 8.9 | 10.0 | 9.2 |
| 166 - 175 g/km | 3.6 | 3.1 | 3.1 | 2.0 | 1.8 | 1.6 | 1.5 | 2.3 | 3.0 | 3.9 | 5.6 |
| 176- 185 g/km | 3.2 | 1.9 | 1.2 | 1.2 | 1.3 | 1.0 | 1.1 | 1.7 | 1.7 | 3.6 | 2.5 |
| 186- 200 g/km | 2.8 | 2.1 | 1.4 | 1.3 | 0.6 | 0.4 | 0.7 | 1.0 | 0.9 | 3.0 | 1.9 |
| 201 - 225 g/km | 1.1 | 0.8 | 0.7 | 0.8 | 0.7 | 0.7 | 0.4 | 0.7 | 1.3 | 1.7 | 1.7 |
| 226 - 255 g/km | 1.4 | 1.0 | 0.7 | 0.4 | 0.3 | 0.2 | 0.2 | 0.2 | 0.4 | 1.5 | 1.5 |
| Over 255 g/km | 0.3 | 0.2 | 0.3 | 0.2 | 0.2 | 0.3 | 0.3 | 0.3 | 0.4 | 0.8 | 0.8 |
| Not known | 0.3 | 0.4 | 0.4 | 0.3 | 0.3 | 0.4 | 0.3 | 0.4 | 0.5 | 0.6 | 1.0 |
| Total | 100.0 | 100.0 | 100.0 | 100.0 | 100.0 | 100.0 | 100.0 | 100.0 | 100.0 | 100.0 | 100.0 |
Source: DVLA//DVADfT - GB figures published as DfT table VEH0256
Figure 13.3: New car average CO2 emissions, Scotland 2011-2021  Figure 13.4: First time car registrations, Scotland, by Emissions band, 2011-2021
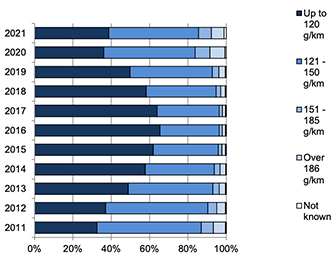
| 2011 | 2012 | 2013 | 2014 | 2015 | 2016 | 2017 | 2018 | 2019 | 2020 | 2021 | |
|---|---|---|---|---|---|---|---|---|---|---|---|
| thousands | |||||||||||
| Up to 100 g/km | 8.8 | 22.0 | 49.2 | 89.5 | 133.2 | 176.5 | 213.1 | 236.5 | 249.0 | 256.7 | 266.8 |
| 101 - 110 g/km | 47.9 | 67.0 | 94.1 | 130.8 | 176.7 | 229.2 | 276.2 | 309.9 | 333.8 | 335.2 | 331.1 |
| 111 - 120 g/km | 127.2 | 158.2 | 198.5 | 243.3 | 279.5 | 317.8 | 355.2 | 391.0 | 424.8 | 430.0 | 436.7 |
| 121 - 130 g/km | 130.5 | 170.2 | 210.9 | 243.2 | 267.3 | 287.8 | 305.1 | 324.8 | 351.6 | 364.3 | 375.5 |
| 131 - 140 g/km | 303.0 | 321.0 | 332.6 | 337.8 | 335.6 | 330.6 | 324.7 | 319.3 | 315.9 | 314.4 | 313.5 |
| 141 - 150 g/km | 288.6 | 293.0 | 290.9 | 282.0 | 265.6 | 250.9 | 235.5 | 223.2 | 218.3 | 217.4 | 215.5 |
| 151 - 165 g/km | 413.7 | 401.8 | 382.5 | 362.5 | 336.3 | 310.6 | 284.5 | 262.7 | 250.3 | 241.9 | 231.5 |
| 166 - 175 g/km | 176.6 | 172.2 | 164.0 | 153.0 | 139.7 | 126.5 | 114.2 | 103.8 | 96.5 | 91.7 | 91.0 |
| 176- 185 g/km | 129.2 | 124.6 | 116.3 | 107.7 | 97.8 | 88.0 | 79.0 | 72.0 | 66.2 | 64.2 | 61.6 |
| 186- 200 g/km | 128.6 | 124.1 | 116.4 | 108.3 | 96.9 | 86.2 | 76.7 | 68.1 | 60.6 | 57.3 | 54.0 |
| 201 - 225 g/km | 104.7 | 100.1 | 93.9 | 87.6 | 79.7 | 72.5 | 65.0 | 58.2 | 53.3 | 49.7 | 46.9 |
| 226 - 255 g/km | 60.3 | 58.6 | 55.8 | 52.2 | 47.2 | 42.4 | 37.8 | 33.6 | 30.3 | 28.9 | 28.1 |
| Over 255 g/km | 48.9 | 46.7 | 44.2 | 41.5 | 37.9 | 34.8 | 31.8 | 29.2 | 26.8 | 25.1 | 23.8 |
| Not known | 296.3 | 225.5 | 169.9 | 130.1 | 100.9 | 79.2 | 63.6 | 53.5 | 47.2 | 43.2 | 42.1 |
| Total | 2,264.4 | 2,285.1 | 2,319.2 | 2,369.3 | 2,394.2 | 2,433.1 | 2,462.4 | 2,486.0 | 2,524.5 | 2,519.8 | 2,518.2 |
| Avg CO2 | 160.2 | 157.4 | 153.9 | 150.1 | 146.2 | 142.4 | 139.1 | 136.5 | 134.5 | 133.3 | 132.1 |
| Column Percentages | |||||||||||
| Up to 100 g/km | 0.4 | 1.0 | 2.1 | 3.8 | 5.6 | 7.3 | 8.7 | 9.5 | 9.9 | 10.2 | 10.6 |
| 101 - 110 g/km | 2.1 | 2.9 | 4.1 | 5.5 | 7.4 | 9.4 | 11.2 | 12.5 | 13.2 | 13.3 | 13.1 |
| 111 - 120 g/km | 5.6 | 6.9 | 8.6 | 10.3 | 11.7 | 13.1 | 14.4 | 15.7 | 16.8 | 17.1 | 17.3 |
| 121 - 130 g/km | 5.8 | 7.4 | 9.1 | 10.3 | 11.2 | 11.8 | 12.4 | 13.1 | 13.9 | 14.5 | 14.9 |
| 131 - 140 g/km | 13.4 | 14.0 | 14.3 | 14.3 | 14.0 | 13.6 | 13.2 | 12.8 | 12.5 | 12.5 | 12.5 |
| 141 - 150 g/km | 12.7 | 12.8 | 12.5 | 11.9 | 11.1 | 10.3 | 9.6 | 9.0 | 8.6 | 8.6 | 8.6 |
| 151 - 165 g/km | 18.3 | 17.6 | 16.5 | 15.3 | 14.0 | 12.8 | 11.6 | 10.6 | 9.9 | 9.6 | 9.2 |
| 166 - 175 g/km | 7.8 | 7.5 | 7.1 | 6.5 | 5.8 | 5.2 | 4.6 | 4.2 | 3.8 | 3.6 | 3.6 |
| 176- 185 g/km | 5.7 | 5.5 | 5.0 | 4.5 | 4.1 | 3.6 | 3.2 | 2.9 | 2.6 | 2.5 | 2.4 |
| 186- 200 g/km | 5.7 | 5.4 | 5.0 | 4.6 | 4.0 | 3.5 | 3.1 | 2.7 | 2.4 | 2.3 | 2.1 |
| 201 - 225 g/km | 4.6 | 4.4 | 4.0 | 3.7 | 3.3 | 3.0 | 2.6 | 2.3 | 2.1 | 2.0 | 1.9 |
| 226 - 255 g/km | 2.7 | 2.6 | 2.4 | 2.2 | 2.0 | 1.7 | 1.5 | 1.4 | 1.2 | 1.1 | 1.1 |
| Over 255 g/km | 2.2 | 2.0 | 1.9 | 1.8 | 1.6 | 1.4 | 1.3 | 1.2 | 1.1 | 1.0 | 0.9 |
| Not known | 13.1 | 9.9 | 7.3 | 5.5 | 4.2 | 3.3 | 2.6 | 2.2 | 1.9 | 1.7 | 1.7 |
| Total | 100.0 | 100.0 | 100.0 | 100.0 | 100.0 | 100.0 | 100.0 | 100.0 | 100.0 | 100.0 | 100.0 |
Source: DVLA//DVADfT - GB figures published as DfT table VEH0206
Figure 13.4: Licensed cars average CO2 emissions, Scotland 2011-2021 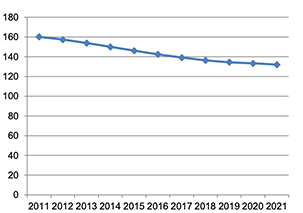 Figure 13.4: Licensed car registrations, Scotland, by Emissions band, 2011-2021
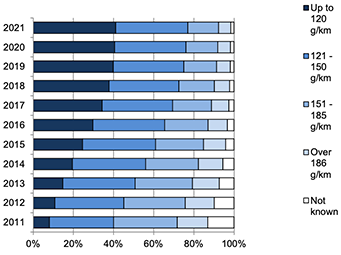
| PiG Eligible Cars 2,3 | ||||||||||||||||||
|---|---|---|---|---|---|---|---|---|---|---|---|---|---|---|---|---|---|---|
| Year | Month | Category 1 | Category 2/3 | Non PiG Eligible Plug-in Cars 2,3 | Non Plug-in Cars | Quadricycles | All Cars | PiG Eligible Motorcycles and tricycles 2,4 | Non PiG Eligible Motorcycles and tricycles 2,4 | All Motorcycles and tricycles 4 | PiG Eligible Light Goods Vehicles 2 | Non PiG Eligible Plug-in Light Goods Vehicles 2 | Non Plug-in Light Goods Vehicles | All Light Goods Vehicles | Heavy Goods Vehicles | Buses and coaches | Other vehicles | Total |
| 2015 | Jan-Mar | 172 | 173 | 20 | - | 8 | 373 | - | 2 | 2 | 28 | 1 | - | 29 | - | 5 | - | 409 |
| 2015 | Apr-Jun | 131 | 168 | 18 | - | 2 | 319 | - | 1 | 1 | 15 | 2 | - | 17 | - | 1 | - | 338 |
| 2015 | Jul-Sep | 123 | 145 | 11 | 1 | 1 | 281 | - | 1 | 1 | 14 | 2 | - | 16 | - | - | 1 | 299 |
| 2015 | Oct-Dec | 188 | 151 | 2 | - | 3 | 344 | - | 1 | 1 | 6 | 2 | - | 8 | - | - | - | 353 |
| 2016 | Jan-Mar | 198 | 237 | 13 | 4 | 1 | 453 | - | 3 | 3 | 26 | - | - | 26 | 1 | - | 2 | 485 |
| 2016 | Apr-Jun | 131 | 132 | 8 | 21 | - | 292 | - | 3 | 3 | 20 | - | - | 20 | - | - | 1 | 316 |
| 2016 | Jul-Sep | 162 | 202 | 9 | 14 | 1 | 388 | - | 2 | 2 | 12 | - | - | 12 | 1 | - | - | 403 |
| 2016 | Oct-Dec | 145 | 128 | 12 | 19 | - | 304 | - | 3 | 3 | 10 | 2 | - | 12 | - | - | - | 319 |
| 2017 | Jan-Mar | 347 | 279 | 14 | 26 | - | 666 | - | 1 | 1 | 23 | 1 | - | 24 | - | - | - | 691 |
| 2017 | Apr-Jun | 248 | 228 | 14 | 29 | 1 | 520 | - | 5 | 5 | 22 | 1 | - | 23 | - | - | 1 | 549 |
| 2017 | Jul-Sep | 254 | 415 | 26 | 26 | - | 721 | 2 | 8 | 10 | 14 | 1 | - | 15 | - | 6 | - | 752 |
| 2017 | Oct-Dec | 150 | 338 | 12 | 30 | - | 530 | 2 | 3 | 5 | 11 | 1 | - | 12 | - | - | 3 | 550 |
| 2018 | Jan-Mar | 276 | 502 | 22 | 24 | - | 824 | - | 1 | 1 | 17 | 2 | - | 19 | - | - | 1 | 845 |
| 2018 | Apr-Jun | 283 | 544 | 62 | 5 | 1 | 895 | 3 | 5 | 8 | 21 | - | - | 21 | - | - | 3 | 927 |
| 2018 | Jul-Sep | 294 | 447 | 51 | 2 | - | 794 | 5 | 6 | 11 | 22 | - | - | 22 | - | - | 8 | 835 |
| 2018 | Oct-Dec | 276 | 62 | 538 | - | 1 | 877 | 2 | 7 | 9 | 21 | - | - | 21 | - | 1 | 14 | 922 |
| 2019 | Jan-Mar | 526 | - | 569 | - | - | 1,095 | 3 | 7 | 10 | 40 | 3 | - | 43 | - | - | 24 | 1,172 |
| 2019 | Apr-Jun | 431 | - | 458 | - | - | 889 | 6 | 10 | 16 | 48 | 1 | - | 49 | 2 | - | 15 | 971 |
| 2019 | Jul-Sep | 870 | - | 539 | - | - | 1,409 | 13 | 2 | 15 | 41 | 4 | - | 45 | - | 3 | 19 | 1,491 |
| 2019 | Oct-Dec | 792 | - | 520 | - | - | 1,312 | 13 | 7 | 20 | 66 | - | - | 66 | - | - | 34 | 1,432 |
| 2020 | Jan-Mar | 1,022 | - | 553 | 1 | - | 1,576 | 5 | 13 | 18 | 75 | - | - | 75 | - | 2 | 16 | 1,687 |
| 2020 | Apr-Jun | 518 | - | 253 | - | - | 771 | 12 | 1 | 13 | 28 | 2 | - | 30 | - | - | 2 | 816 |
| 2020 | Jul-Sep | 2,094 | - | 1,793 | - | - | 3,887 | 29 | 3 | 32 | 103 | 1 | - | 104 | - | 6 | 13 | 4,042 |
| 2020 | Oct-Dec | 2,277 | - | 2,059 | - | - | 4,336 | 29 | 7 | 36 | 50 | - | - | 50 | 2 | 16 | 5 | 4,445 |
| 2021 | Jan-Mar | [Not available] 5 | - | [Not available] 5 | - | - | 3,827 | 22 | 4 | 26 | 117 | 3 | - | 120 | 1 | 3 | 10 | 3,987 |
| 2021 | Apr-Jun | 2,094 | - | 1,793 | - | - | 3,887 | 29 | 3 | 32 | 103 | 1 | - | 104 | - | 6 | 13 | 4,042 |
| 2021 | Jul-Sep | 2,277 | - | 2,059 | - | - | 4,336 | 29 | 7 | 36 | 50 | - | - | 50 | 2 | 16 | 5 | 4,445 |
| 2021 | Oct-Dec | [Not available] 5 | - | [Not available] 5 | - | - | 4,977 | 48 | 11 | 59 | 186 | 6 | - | 192 | 1 | 85 | 5 | 5,319 |
| 2022 | Jan-Mar | [Not available] 5 | - | [Not available] 5 | - | - | 5,125 | [Not available] 5 | [Not available] 5 | 57 | [Not available] 5 | [Not available] 5 | - | 128 | - | 104 | 5 | 5,419 |
| 2013 | Whole year | 144 | 47 | 4 | - | 1 | 196 | - | - | - | 9 | 3 | - | 12 | - | 1 | 5 | 214 |
| 2014 | Whole year | 533 | 279 | 23 | - | 3 | 838 | 3 | 1 | 4 | 42 | 5 | - | 47 | - | 7 | 4 | 900 |
| 2015 | Whole year | 614 | 637 | 51 | 1 | 14 | 1,317 | - | 5 | 5 | 63 | 7 | - | 70 | - | 6 | 1 | 1,399 |
| 2016 | Whole year | 636 | 699 | 42 | 58 | 2 | 1,437 | - | 11 | 11 | 68 | 2 | - | 70 | 2 | - | 3 | 1,523 |
| 2017 | Whole year | 999 | 1,260 | 66 | 111 | 1 | 2,437 | 4 | 17 | 21 | 70 | 4 | - | 74 | - | 6 | 4 | 2,542 |
| 2018 | Whole year | 1,129 | 1,555 | 673 | 31 | 2 | 3,390 | 10 | 19 | 29 | 81 | 2 | - | 83 | - | 1 | 26 | 3,529 |
| 2019 | Whole year | 2,619 | - | 2,086 | - | - | 4,705 | 35 | 26 | 61 | 195 | 8 | - | 203 | 2 | 3 | 92 | 5,066 |
| 2020 | Whole year | 5,911 | - | 4,658 | 1 | - | 10,570 | 75 | 24 | 99 | 256 | 3 | - | 259 | 2 | 24 | 36 | 10,990 |
| 2021 | Whole year | [Not available] 5 | - | [Not available] 5 | 1 | - | 16,964 | 184 | 31 | 215 | 545 | 24 | - | 569 | 6 | 129 | 17 | 17,900 |
Source: DVLA/DfT
1. Ultra low emission vehicles (ULEVs) are vehicles that are reported to emit less than 75g of carbon dioxide (CO2) from the tailpipe for every kilometre travelled. In practice, the term typically refers to battery electric, plug-in hybrid electric and fuel cell electric vehicles. These figures are subject to minor revision between quarterly publications when individual vehicles are reviewed against the criteria. See Notes and Definitions for more information on how reported emissions are calculated.
2. Plug-in grant eligibility is applied to all vehicles of eligible models at the date of latest table update. Therefore earlier data in the series may be changed retrospectively as models are added to the eligible list. In addition, if a vehicle becomes ineligible for the plug-in grant, it will remain in this list for historical comparison. For more details, see:
https://www.gov.uk/plug-in-car-van-grants/eligibility
3. Changes to the Plug-in Car Grant came into effect on 21 October 2018 and 12 March 2020. Vehicles registered for the first time on or after these dates are categorised using the new eligibility criteria. There may be some cars that were purchased with a plug-in car grant but were registered for the first time after this date. For more information about the changes, see:
https://www.gov.uk/government/news/plug-in-vehicle-grants-update-following-todays-budget
4. Some powerful electric bikes have to be registered as mopeds and will be included here. For more details, see:
https://www.gov.uk/electric-bike-rules
5. Changes to the Plug-in Car Grant came into effect on 18 March 2021, which impacted the eligibility of car models at the vehicle trim level. As a result, the plug-in car grant eligible models cannot be robustly estimated from the current data source from 2021 Q1 onwards. For more information about the changes, see:
| PiG Eligible Cars 2,3 | |||||||||||||||||
|---|---|---|---|---|---|---|---|---|---|---|---|---|---|---|---|---|---|
| Quarter | Category 1 | Category 2/3 | Non PiG Eligible Plug-in Cars 2,3 | Non Plug-in Cars | Quadricycles | All Cars | PiG Eligible Motorcycles and tricycles 2,4 | Non PiG Eligible Motorcycles and tricycles 2,4 | All Motorcycles and tricycles 4 | PiG Eligible Light Goods Vehicles 2 | Non PiG Eligible Plug-in Light Goods Vehicles 2 | Non Plug-in Light Goods Vehicles | All Light Goods Vehicles | Heavy Goods Vehicles | Buses and coaches | Other vehicles | Total |
| 2012 Q1 | 97 | - | 61 | - | 1 | 159 | - | 66 | 66 | 1 | 117 | - | 118 | 8 | 2 | 72 | 425 |
| 2012 Q2 | 119 | 12 | 63 | - | 14 | 208 | - | 66 | 66 | 6 | 119 | - | 125 | 9 | 2 | 82 | 492 |
| 2012 Q3 | 136 | 31 | 63 | - | 15 | 245 | - | 59 | 59 | 31 | 122 | - | 153 | 9 | 2 | 78 | 546 |
| 2012 Q4 | 168 | 39 | 64 | - | 16 | 287 | - | 51 | 51 | 42 | 121 | - | 163 | 9 | 3 | 75 | 588 |
| 2013 Q1 | 187 | 55 | 63 | - | 16 | 321 | - | 46 | 46 | 48 | 121 | - | 169 | 8 | 3 | 75 | 622 |
| 2013 Q2 | 246 | 68 | 62 | - | 16 | 392 | - | 46 | 46 | 48 | 125 | - | 173 | 7 | 3 | 78 | 699 |
| 2013 Q3 | 290 | 74 | 66 | - | 15 | 445 | - | 45 | 45 | 55 | 120 | - | 175 | 8 | 4 | 78 | 755 |
| 2013 Q4 | 330 | 85 | 66 | - | 16 | 497 | - | 43 | 43 | 58 | 119 | - | 177 | 8 | 4 | 80 | 809 |
| 2014 Q1 | 437 | 104 | 65 | - | 16 | 622 | - | 41 | 41 | 70 | 119 | - | 189 | 7 | 4 | 82 | 945 |
| 2014 Q2 | 555 | 152 | 65 | - | 15 | 787 | 3 | 38 | 41 | 80 | 120 | - | 200 | 8 | 5 | 81 | 1,122 |
| 2014 Q3 | 702 | 273 | 73 | - | 17 | 1,065 | 3 | 31 | 34 | 89 | 120 | - | 209 | 9 | 12 | 82 | 1,411 |
| 2014 Q4 | 862 | 363 | 83 | - | 18 | 1,326 | 3 | 28 | 31 | 96 | 126 | - | 222 | 9 | 13 | 84 | 1,685 |
| 2015 Q1 | 1,024 | 541 | 101 | - | 27 | 1,693 | 3 | 30 | 33 | 113 | 126 | - | 239 | 9 | 21 | 82 | 2,077 |
| 2015 Q2 | 1,149 | 716 | 111 | - | 29 | 2,005 | 3 | 29 | 32 | 133 | 116 | - | 249 | 9 | 22 | 79 | 2,396 |
| 2015 Q3 | 1,262 | 891 | 100 | 1 | 29 | 2,283 | 4 | 26 | 30 | 150 | 109 | - | 259 | 8 | 21 | 78 | 2,679 |
| 2015 Q4 | 1,451 | 1,060 | 102 | 1 | 32 | 2,646 | 4 | 28 | 32 | 152 | 118 | - | 270 | 8 | 21 | 78 | 3,055 |
| 2016 Q1 | 1,633 | 1,334 | 107 | 5 | 36 | 3,115 | 4 | 29 | 33 | 176 | 115 | - | 291 | 9 | 21 | 76 | 3,545 |
| 2016 Q2 | 1,768 | 1,512 | 116 | 26 | 36 | 3,458 | 4 | 33 | 37 | 202 | 114 | - | 316 | 9 | 21 | 77 | 3,918 |
| 2016 Q3 | 1,961 | 1,761 | 121 | 40 | 36 | 3,919 | 4 | 37 | 41 | 219 | 113 | - | 332 | 10 | 21 | 69 | 4,392 |
| 2016 Q4 | 2,125 | 1,931 | 127 | 58 | 37 | 4,278 | 4 | 31 | 35 | 229 | 114 | - | 343 | 9 | 22 | 65 | 4,752 |
| 2017 Q1 | 2,419 | 2,220 | 144 | 81 | 33 | 4,897 | 4 | 30 | 34 | 256 | 117 | - | 373 | 8 | 23 | 65 | 5,400 |
| 2017 Q2 | 2,670 | 2,479 | 161 | 114 | 33 | 5,457 | 4 | 35 | 39 | 272 | 114 | - | 386 | 9 | 23 | 65 | 5,979 |
| 2017 Q3 | 3,002 | 2,899 | 171 | 137 | 28 | 6,237 | 3 | 43 | 46 | 289 | 113 | - | 402 | 9 | 28 | 67 | 6,789 |
| 2017 Q4 | 3,245 | 3,237 | 177 | 168 | 25 | 6,852 | 5 | 39 | 44 | 292 | 113 | - | 405 | 9 | 28 | 67 | 7,405 |
| 2018 Q1 | 3,562 | 3,752 | 194 | 190 | 23 | 7,721 | 6 | 38 | 44 | 318 | 115 | - | 433 | 9 | 27 | 68 | 8,302 |
| 2018 Q2 | 3,810 | 4,335 | 255 | 192 | 26 | 8,618 | 12 | 42 | 54 | 336 | 107 | - | 443 | 8 | 27 | 67 | 9,217 |
| 2018 Q3 | 4,241 | 4,869 | 287 | 189 | 27 | 9,613 | 15 | 48 | 63 | 362 | 106 | - | 468 | 8 | 28 | 75 | 10,255 |
| 2018 Q4 | 4,520 | 5,008 | 814 | 189 | 30 | 10,561 | 17 | 51 | 68 | 383 | 104 | - | 487 | 9 | 29 | 91 | 11,245 |
| 2019 Q1 | 5,024 | 5,003 | 1,366 | 184 | 30 | 11,607 | 19 | 54 | 73 | 416 | 103 | - | 519 | 9 | 26 | 111 | 12,345 |
| 2019 Q2 | 5,414 | 5,003 | 1,835 | 178 | 29 | 12,459 | 25 | 60 | 85 | 468 | 95 | - | 563 | 10 | 26 | 123 | 13,266 |
| 2019 Q3 | 6,238 | 5,001 | 2,376 | 176 | 30 | 13,821 | 39 | 55 | 94 | 496 | 100 | - | 596 | 10 | 30 | 136 | 14,687 |
| 2019 Q4 | 7,020 | 5,001 | 2,910 | 165 | 28 | 15,124 | 55 | 59 | 114 | 563 | 100 | - | 663 | 10 | 30 | 169 | 16,110 |
| 2020 Q1 | 8,114 | 5,021 | 3,455 | 167 | 30 | 16,787 | 61 | 70 | 131 | 632 | 100 | - | 732 | 9 | 31 | 183 | 17,873 |
| 2020 Q2 | 8,428 | 4,890 | 3,678 | 157 | 28 | 17,181 | 69 | 70 | 139 | 647 | 98 | - | 745 | 8 | 27 | 177 | 18,277 |
| 2020 Q3 | 10,412 | 4,758 | 5,509 | 147 | 29 | 20,855 | 96 | 76 | 172 | 745 | 90 | - | 835 | 8 | 31 | 194 | 22,095 |
| 2020 Q4 | 12,685 | 4,466 | 7,526 | 144 | 29 | 24,850 | 119 | 85 | 204 | 785 | 89 | - | 874 | 9 | 51 | 201 | 26,189 |
| 2021 Q1 | [Not available] 5 | 4,437 | [Not available] 5 | 152 | 26 | 28,639 | 141 | 88 | 229 | 892 | 91 | - | 983 | 15 | 60 | 209 | 30,135 |
| 2021 Q2 | [Not available] 5 | 4,415 | [Not available] 5 | 158 | 24 | 32,486 | 181 | 89 | 270 | 1,017 | 104 | - | 1,121 | 20 | 63 | 210 | 34,170 |
| 2021 Q3 | [Not available] 5 | 4,302 | [Not available] 5 | 161 | 24 | 36,755 | 241 | 89 | 330 | 1,105 | 106 | - | 1,211 | 20 | 95 | 223 | 38,634 |
| 2021 Q4 | [Not available] 5 | 4,255 | [Not available] 5 | 147 | 21 | 41,378 | 276 | 91 | 367 | 1,295 | 112 | - | 1,407 | 20 | 161 | 163 | 43,496 |
| 2022 Q1 | [Not available] 5 | 4,271 | [Not available] 5 | 146 | 20 | 46,825 | [Not available] 5 | [Not available] 5 | 401 | [Not available] 5 | [Not available] 5 | - | 1,537 | 20 | 269 | 167 | 49,219 |
1. Ultra low emission vehicles (ULEVs) are vehicles that are reported to emit less than 75g of carbon dioxide (CO2) from the tailpipe for every kilometre travelled. In practice, the term typically refers to battery electric, plug-in hybrid electric and fuel cell electric vehicles. These figures are subject to minor revision between quarterly publications when individual vehicles are reviewed against the criteria. See Notes and Definitions for more information on how reported emissions are calculated.
2. Plug-in grant eligibility is applied to all vehicles of eligible models at the date of latest table update. Therefore earlier data in the series may be changed retrospectively as models are added to the eligible list. In addition, if a vehicle becomes ineligible for the plug-in grant, it will remain in this list for historical comparison. For more details, see:
https://www.gov.uk/plug-in-car-van-grants/eligibility
3. Changes to the Plug-in Car Grant came into effect on 21 October 2018 and 12 March 2020. Vehicles registered for the first time on or after these dates are categorised using the new eligibility criteria. There may be some cars that were purchased with a plug-in car grant but were registered for the first time after this date. For more information about the changes, see:
https://www.gov.uk/government/news/plug-in-vehicle-grants-update-following-todays-budget
4. Some powerful electric bikes have to be registered as mopeds and will be included here. For more details, see:
https://www.gov.uk/electric-bike-rules
5. Changes to the Plug-in Car Grant came into effect on 18 March 2021, which impacted the eligibility of car models at the vehicle trim level. As a result, the plug-in car grant eligible models cannot be robustly estimated from the current data source from 2021 Q1 onwards. For more information about the changes, see:
Figure 13.5: Ultra Low Emission Vehicles licensed in Scotland - growth from 2018 Q1 to 2022 Q3
| Propulsion type | ||||||||
|---|---|---|---|---|---|---|---|---|
| Diesel | Electric diesel | Electricity | Fuel cells | Gas | Gas bi-fuel | Gas-diesel | Hybrid electric | |
| Body type | ||||||||
| Agricultural | 2.4 | - | - | - | - | - | - | - |
| Buses & coaches | 0.4 | - | 0.1 | - | - | - | - | - |
| Cars | 16.2 | 2.9 | 10.8 | - | - | 0.2 | - | 25.6 |
| Goods - heavy | 3.5 | - | - | - | - | - | - | - |
| Goods - light | 24.6 | - | 0.6 | - | - | - | - | - |
| Motorcycles, mopeds & scooters | - | - | 0.2 | - | - | - | - | - |
| Others 1 | 2.1 | - | 0.3 | - | - | - | - | - |
| Special Purpose | - | - | - | - | - | - | - | - |
| Taxis | 0.2 | - | - | - | - | - | - | - |
| Tricycles | - | - | - | - | - | - | - | - |
| Grand Total | 49.5 | 2.9 | 12.0 | - | - | 0.2 | - | 25.6 |
Source: DVLA/DfT
c. Value has been suppressed to avoid disclosing personal information.
~ denotes fewer than 50.
1. Iincludes Invalid Vehicle (Mobility scooters), Lift Trucks, Tel Material Handlers, Hydraulic Excavator, Rear Digger, Ambulance, Fire Engine, Street Cleansing, Roller and Loading Shovel.
Pure Electric 'others' are Invalid vehicles or Lift Trucks.
| Propulsion type | |||||||||||||
|---|---|---|---|---|---|---|---|---|---|---|---|---|---|
| Diesel | Electric diesel | Electricity | Fuel cells | Gas | Gas bi-fuel | Gas-diesel | Hybrid electric | New fuel tech-nology | Petrol | Petrol/gas | Steam | Grand total | |
| Body type | thousand | ||||||||||||
| Agricultural | 51.4 | - | - | - | - | - | - | - | - | 6.2 | - | - | 57.7 |
| Buses & coaches | 12.8 | - | 0.2 | - | - | - | - | - | - | 0.1 | - | - | 13.1 |
| Cars | 970.6 | 5.2 | 24.2 | - | - | 0.7 | - | 71.9 | - | 1,445.2 | 0.4 | - | 2,518.2 |
| Goods - heavy | 36.2 | - | - | - | 0.1 | - | - | - | - | 0.1 | - | - | 36.3 |
| Goods - light | 322.6 | - | 1.3 | - | - | 0.2 | - | 0.1 | - | 6.9 | 0.1 | - | 331.2 |
| Motorcycles, mopeds & scooters | - | - | 0.4 | - | - | - | - | - | - | 75.8 | - | - | 76.2 |
| Not recorded | 0.2 | - | - | - | - | - | - | - | - | 0.1 | - | - | 0.3 |
| Others 1 | 20.2 | - | 4.7 | - | 0.1 | - | - | - | - | 1.0 | - | - | 26.2 |
| Special purpose | 0.2 | - | - | - | - | - | - | - | - | - | - | - | 0.3 |
| Taxis | 2.8 | - | - | - | - | 0.1 | - | 0.2 | - | - | - | - | 3.1 |
| Tricycles | - | - | - | - | - | - | - | - | - | 1.0 | - | - | 1.0 |
| Grand Total | 1,417.1 | 5.2 | 30.9 | - | 0.2 | 1.0 | - | 72.1 | - | 1,536.4 | 0.5 | 0.1 | 3,063.6 |
Source: DVLA/DfT
c. Value has been suppressed to avoid disclosing personal information.
~ denotes fewer than 50.
1. Iincludes Invalid Vehicle (Mobility scooters), Lift Trucks, Tel Material Handlers, Hydraulic Excavator, Rear Digger, Ambulance, Fire Engine, Street Cleansing, Roller and Loading Shovel.
Pure Electric 'others' are Invalid vehicles or Lift Trucks.
| 2022 | CP Units as at Dec 22 | ||
|---|---|---|---|
| Local Authority | Charging Sessions | Total kWh | Total |
| Aberdeen Council | 24,577 | 517,495 | 69 |
| Aberdeenshire Council | 37,580 | 760,866 | 97 |
| Angus Council | 37,999 | 825,660 | 64 |
| Argyll and Bute Council | 19,759 | 376,700 | 66 |
| Clackmannanshire Council | 29,687 | 691,422 | 32 |
| Comhairle nan Eilean Siar Council | 8,453 | 175,298 | 36 |
| Dumfries and Galloway Council | 28,815 | 681,020 | 141 |
| Dundee City Council | 70,729 | 1,189,923 | 118 |
| East Ayrshire Council | 114,606 | 2,573,243 | 71 |
| East Dunbartonshire Council | 46,498 | 697,587 | 21 |
| East Lothian Council | 61,950 | 1,297,878 | 111 |
| East Renfrewshire Council | 25,245 | 472,745 | 16 |
| Edinburgh City Council | 75,785 | 1,472,635 | 149 |
| Falkirk Council | 48,931 | 1,059,559 | 67 |
| Fife Council | 35,075 | 822,306 | 96 |
| Glasgow City Council | 179,815 | 3,480,012 | 214 |
| Highland Council | 78,702 | 1,731,741 | 165 |
| Inverclyde Council | 13,561 | 250,290 | 25 |
| Midlothian Council | 15,735 | 289,637 | 39 |
| Moray Council | 20,002 | 454,214 | 43 |
| North Ayrshire Council | 22,260 | 511,663 | 42 |
| North Lanarkshire Council | 217,709 | 4,949,183 | 120 |
| Orkney Island Council | 7,005 | 116,149 | 34 |
| Perth and Kinross Council | 113,709 | 2,453,525 | 72 |
| Renfrewshire Council | 91,828 | 1,698,058 | 85 |
| Scottish Borders Council | 26,123 | 464,408 | 50 |
| Shetland Council | 17,100 | 328,033 | 28 |
| South Ayrshire Council | 74,722 | 1,589,548 | 44 |
| South Lanarkshire Council | 243,363 | 5,634,785 | 137 |
| Stirling Council | 142,734 | 3,089,556 | 119 |
| West Dunbartonshire Council | 19,950 | 357,514 | 28 |
| West Lothian Council | 79,946 | 1,985,135 | 49 |
| Totals | 2,029,953 | 42,997,788 | 2,448 |
Notes
1. ChargePlace Scotland (CPS) (www.chargeplacescotland.org) is the national network of publicly available Electric Vehicle charge points, funded by the Scottish Government.
2. Data is sourced from the ChargePlace Scotland back-office system. Usage data is based on valid charging sessions recorded by the back-office. A valid charging event is considered to be over 1 kWh drawn and whereby the session was longer than 120 seconds.
3. The kWh Drawn is the total energy provided during a charging event. If energy is transferred at a constant rate over a period of time, the total energy transferred in kilowatt hours is equal to the power in kilowatts multiplied by the time in hours.
< Previous | Contents | Next >