Chapter 12: International Comparisons
Chapter 12: International Comparisons
International Comparisons
1. Introduction
1.1 This chapter compares some statistics for Scotland with the 28 EU member countries over a mixture of years. Due to the increased EU membership over the years overall comparisons with EU-15 and EU-28 countries are made.
1.2 Due to definitional variations across countries comparisons may not be exact (see Sections 3, 4 & 5), especially where noticeable difference exist between the UK figure and the UK/GB calculated on the same basis as the figure for Scotland.
1.4 In some cases, the EU countries' figures do not all relate to the same year. (See the Notes and Definitions section, page 228). Because of such differences, the commentary in Section 2 generally does not reference the year. General trends will tend to be similar over recent years and so the impact of this should be minimal.
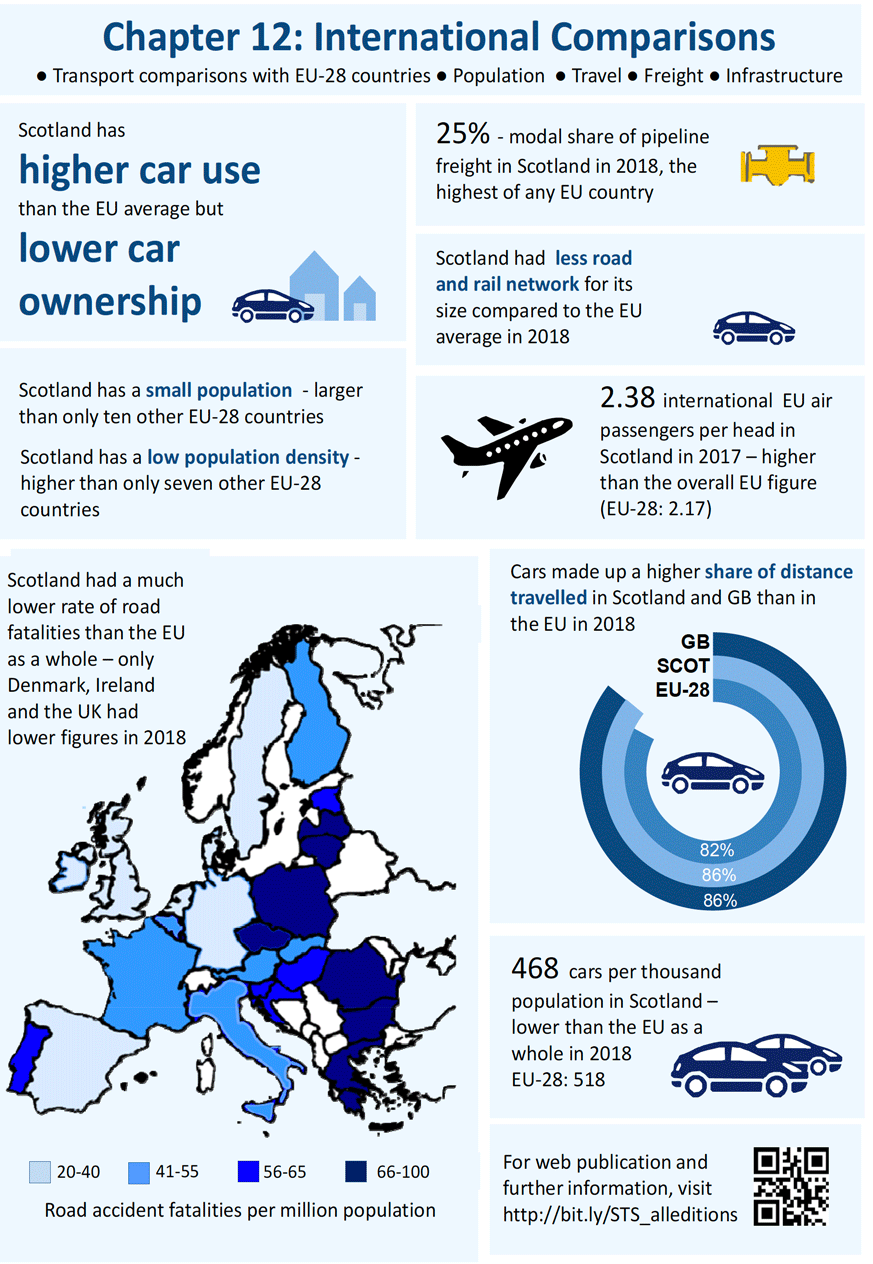
Key Points
- Scotland has less road and rail network by area compared to the EU average.
- Scotland has higher car use than the EU average but lower car ownership
- The proportion of freight carried by road is lower than in the rest of the EU due to the higher proportion carried by pipeline in Scotland.
2. Main points
Population
2.1 Scotland has a low population: only ten of the EU-28 (Slovak Republic, Ireland, Croatia, Lithuania, Slovenia, Latvia, Estonia, Cyprus, Luxembourg and Malta) have fewer people. Scotland also has a low population density (70 people per square kilometre) compared with the overall EU average (EU-15: 123; EU-28: 115). Only seven of the EU-28 countries (Bulgaria, Estonia, Finland, Ireland, Lithuania, Latvia and Sweden) have a lower population density than Scotland.
Road Network
2.2 For its area, Scotland has a short Motorway network (6.1 km of Motorway per thousand square kilometres), well below the overall EU figure (EU-15: 20.5; EU-28: 17.4). Six of the EU-28 countries (Estonia, Finland, Lithuania, Poland, Romania and Sweden) have a lower figure than Scotland. This does not include Latvia and Malta which have no motorway.
2.3 The total length of the Scottish road network relative to the area of the country is 13 per cent below the EU-28 average when 'other roads' and unclassified roads in Scotland are excluded (Scotland: 370 km of road per thousand square kilometres; EU-15: 446; EU-28: 428).
2.4 Scotland has a short rail network for its area (35.4 km of route per thousand square kilometres) compared with the overall EU figure (EU-15: 46.3; EU-28: 48.5). Nine of the 28 EU countries (Estonia, Finland, Greece, Ireland, Latvia, Lithuania, Portugal, Spain and Sweden) have a lower value than Scotland. This does not include Cyprus and Malta which do not have a railway network.
Vehicles per Population
2.5 Scotland has few cars for the size of its population (468 per thousand population) compared with the EU as a whole (EU-15: 525; EU-28: 518). Nine of the EU-28 countries have lower figures than Scotland.
2.6 Scotland also has few goods vehicles relative to the size of its population (65 per thousand population) compared with the overall EU average (EU-15: 78; EU-28: 77). Of the EU-28, twelve countries have lower figures.
2.7 The number of new vehicle registrations in Scotland was relatively high (33 per thousand population), higher than the EU-28 average – nine of the EU-28 countries had higher rates (France, UK, Sweden, Slovenia, Austria, Denmark, Belgium, Germany, and Luxembourg).
Distances travelled
2.8 Walking, cycling and motorcycles are excluded from the calculation of these modal shares, for consistency with the figures in the relevant table of the EU publication. That table shows just four modes (passenger cars, buses/coaches, railways and tram/metro) and gives their shares of the total for those four modes. Passenger cars account for a slightly higher percentage of the total travel by those four modes in Scotland (85.7%) than the EU as a whole (EU-15 86.9%; EU-28: 81.8%).
Air travel
2.9 Relative to the size of its population, Scotland has more international air passengers to or from the EU-28 countries (2.38 per head of the population, not counting internal UK traffic) than the overall EU figure (EU-15: 2.46; EU-28: 2.17).
Road Fatalities
2.10 Scotland's number of road deaths per million population is well below the overall EU average (Scotland: 30; EU-15: 43; EU-28: 49). Of the EU-28 countries, only Denmark, Ireland and the UK had a lower figures.
Freight
2.11 For freight transport, road has a low modal share in Scotland (62.7%) compared with the overall EU figure (EU-15: 73.3%; EU-28: 73.6%). The modal share of pipelines (25.0%) was higher than in any EU country. The modal shares of rail and inland waterways in Scotland are both below the overall figures for the EU-28.
3.1 Table Comparisons
- Rates (per thousand population or per thousand square km) are based on the countries' areas and populations presented in EU Energy and Transport in Figures. As figures are rounded to a few decimal places, results won't be as precise as they using exact figures. Therefore figures should be regarded as broad indicators;
- Country figures may not be on exactly the basis due to the availability of data. There is plenty of scope for differences in interpretation or definition (e.g. should the surface area of inland lochs and lakes be included when calculating a country's area?);
- Scotland figures may differ from those elsewhere in Scottish Transport Statistics in order to provide Scottish figures on the same basis as the GB or UK figures given in the final two columns.
- GB and UK figures are on the same basis as the figures for Scotland. The closer that these figures are to the UK (or GB) figures from EU Energy and Transport in Figures (columns to the left of the EU-15 and EU-28), the closer that the Scottish basis is to the EU countries.
- Many of the Scotland figures are derived from GB-wide surveys conducted by the Department for Transport and UK figures may not be as readily available. As Northern Ireland may account for a small percentage of a UK figure, there is likely to be little difference between figures for GB and UK, particularly for rates.
- Some of the Scotland, GB and/or UK figures appear with more significant digits than the figures for the EU countries, increasing the precision of the rates.
| EU countries | from EU Energy and Transport in Figures(2017 edition) | Scotland/ GB/ UK figures ( # ) | |||||||||||||||||||||||||||||||||||
|---|---|---|---|---|---|---|---|---|---|---|---|---|---|---|---|---|---|---|---|---|---|---|---|---|---|---|---|---|---|---|---|---|---|---|---|---|---|
| Year of data (most countries) | Other year/issues (some countries) | EU publication table | Scottish figure (same or a similar basis) ( # ) | Austria | Belgium | Bulgaria | Cyprus | Czech Republic | Germany | Denmark | Estonia | Greece (+) | Spain | Finland | France | Croatia | Hungary | Ireland | Italy | Lithuania | Luxembourg | Latvia | Malta (+) | Netherlands | Poland | Portugal | Romania | Sweden | Slovenia | Slovak Republic | UK | EU-28 | EU-15 | Scotland | GB (same basis) | UK (same basis) | |
| SCOT | AT | BE | BG | CY | CZ | DE | DK | EE | EL | ES | FI | FR | HR | HU | IE | IT | LT | LU | LV | MT | NL | PL | PT | RO | SE | SI | SK | UK | EU-28 | EU-15 | SCOT | GB | UK | ||||
| General data | |||||||||||||||||||||||||||||||||||||
| Population (at 1 Jan) | |||||||||||||||||||||||||||||||||||||
| million | 2019 | 1.1 | 5.46 | 8.86 | 11.46 | 7.00 | 0.88 | 10.65 | 83.02 | 5.81 | 1.33 | 10.73 | 46.94 | 5.52 | 67.01 | 4.08 | 9.77 | 4.90 | 60.36 | 2.79 | 0.61 | 1.92 | 0.49 | 17.28 | 37.97 | 10.28 | 19.41 | 10.23 | 2.08 | 5.45 | 66.65 | 513.47 | 409.65 | 5.46 | 64.90 | 66.44 | |
| Area | |||||||||||||||||||||||||||||||||||||
| '000 sq km | 1.1 | 78.0 | 83.9 | 30.5 | 111.0 | 9.3 | 78.9 | 357.1 | 43.1 | 45.2 | 132.0 | 506.0 | 338.4 | 633.1 | 56.6 | 93.0 | 70.3 | 301.3 | 65.3 | 2.6 | 64.6 | 0.3 | 41.5 | 312.69 | 92.1 | 238.4 | 450.3 | 20.3 | 49.0 | 243.8 | 4,470.58 | 3326.1 | 78.0 | 229.0 | 243.8 | ||
| Population density (at 1 Jan) | |||||||||||||||||||||||||||||||||||||
| people per sq km | 2019 | calc'd | 70 | 106 | 375 | 63 | 95 | 135 | 232 | 135 | 29 | 81 | 93 | 16 | 106 | 72 | 105 | 70 | 200 | 43 | 237 | 30 | 1563 | 416 | 121 | 112 | 81 | 23 | 103 | 111 | 273 | 115 | 123 | 70 | 283 | 272 | |
| Infrastructure and vehicles | |||||||||||||||||||||||||||||||||||||
| Motorways | |||||||||||||||||||||||||||||||||||||
| km | 2018 | 2.5.1 | 476 | 1,749 | 1,763 | 757 | 257 | 1,252 | 13,141 | 1,329 | 154 | 2,098 | 15,585 | 926 | 11,671 | 1,310 | 1,982 | 916 | 6,943 | 324 | 165 | - | - | 2,756 | 1,637 | 3,065 | 823 | 2,132 | 623 | 482 | 3,857 | 77,696 | 68,095 | 476 | 3,723 | 3,838 | |
| km per '000 sq km | 2018 | calc'd | 6.1 | 20.8 | 57.8 | 6.8 | 27.8 | 15.9 | 36.8 | 30.8 | 3.4 | 15.9 | 30.8 | 2.7 | 18.4 | 23.1 | 21.3 | 13.0 | 23.0 | 5.0 | 63.8 | - | - | 66.4 | 5.2 | 33.3 | 3.5 | 4.7 | 30.7 | 9.8 | 15.8 | 17.4 | 20.5 | 6.1 | 16.3 | 15.7 | |
| All roads ( @ ) | |||||||||||||||||||||||||||||||||||||
| '000 km | 2018 | Excluding Other roads (U roads) | 2.5.2 | 28.8 | 36.3 | 16.3 | 7.7 | 8.1 | 55.7 | 229.8 | 74.8 | 16.6 | 42.3 | 165.6 | 26.9 | 399.6 | 17.9 | 32.1 | 18.4 | 183.0 | 21.6 | 2.9 | 7.1 | 0.5 | 13.2 | 172.9 | 14.3 | 52.8 | 172.9 | 19.9 | 18.0 | 86.8 | 1,914 | 1,483 | 28.8 | 167.3 | 177.4 |
| km per '000 sq km | 2018 | calc'd | 370 | 432 | 535 | 69 | 871 | 707 | 644 | 1,735 | 367 | 320 | 327 | 80 | 631 | 316 | 345 | 262 | 607 | 330 | 1,119 | 110 | 1,646 | 317 | 553 | 155 | 222 | 384 | 982 | 368 | 356 | 428 | 446 | 370 | 731 | 728 | |
| Railways | |||||||||||||||||||||||||||||||||||||
| km | 2018 | 2.5.3 | 2,758 | 4,953 | 3,602 | 4,030 | 9,406 | 39,299 | 2,519 | 1,033 | 2,292 | 15,893 | 5,925 | 27,594 | 2,605 | 7,752 | 2,045 | 16,781 | 1,911 | 275 | 1,860 | - | 3,220 | 18,536 | 2,546 | 10,765 | 10,906 | 1,209 | 3,627 | 16,294 | 216,878 | 154,144 | 2,758 | 15,847 | 16,187 | ||
| km per '000 sq km | 2018 | calc'd | 35.4 | 59.0 | 118.0 | 36.3 | - | 119.3 | 110.0 | 58.4 | 22.8 | 17.4 | 31.4 | 17.5 | 43.6 | 46.0 | 83.3 | 29.1 | 55.7 | 29.3 | 106.3 | 28.8 | - | 77.5 | 59.3 | 27.6 | 45.2 | 24.2 | 59.6 | 74.0 | 66.8 | 48.5 | 46.3 | 35.4 | 69.2 | 66.4 | |
| Passenger cars | |||||||||||||||||||||||||||||||||||||
| million | 2018 | 2.6.2 | 2.49 | 4.98 | 2.80 | 2.77 | 0.55 | 5.75 | 47.10 | 2.59 | 0.75 | 5.41 | 24.07 | 3.49 | 32.03 | 1.67 | 3.64 | 2.13 | 39.02 | 1.43 | 0.42 | 0.69 | 0.30 | 8.53 | 23.43 | 5.28 | 6.45 | 4.87 | 1.14 | 2.32 | 32.49 | 266.12 | 215.22 | 2.49 | 31.52 | 32.5 | |
| per 1,000 pop'n | 2018 | calc'd | 468 | 562 | 245 | 396 | 629 | 540 | 567 | 447 | 563 | 504 | 513 | 633 | 478 | 409 | 373 | 434 | 646 | 512 | 676 | 361 | 608 | 494 | 617 | 514 | 332 | 476 | 549 | 426 | 488 | 518 | 525 | 468 | 486 | 489 | |
| Powered two wheelers ( $ ) | |||||||||||||||||||||||||||||||||||||
| thousands | 2018 | 02 & '04 | 2.6.5 | 72 | 847 | 649 | 190 | 40 | 1,132 | 4,439 | 199 | 55 | 1,610 | 5,393 | 614 | 3,034 | 157 | 176 | 40 | 9,355 | 45 | 31 | 56 | 27 | 1,896 | 2,853 | 616 | 136 | 674 | 131 | 140 | 1,265 | 35,801 | 30,662 | 72 | 1,243 | 1,265 |
| Goods vehicles | |||||||||||||||||||||||||||||||||||||
| thousands | 2018 | 2.6.4 | 344 | 495 | 920 | 438 | 111 | 711 | 3,368 | 432 | 122 | 1,359 | 5,207 | 627 | 6,948 | 181 | 581 | 355 | 4,314 | 126 | 45 | 89 | 49 | 1,058 | 3,758 | 1,370 | 1,034 | 656 | 110 | 325 | 4,652 | 39,441 | 31,806 | 344 | 4,510 | 4,652 | |
| per 1,000 pop'n | 2018 | calc'd | 65 | 56 | 80 | 63 | 127 | 67 | 41 | 74 | 92 | 127 | 111 | 114 | 104 | 45 | 59 | 72 | 71 | 45 | 73 | 46 | 99 | 61 | 99 | 133 | 53 | 64 | 53 | 60 | 70 | 77 | 78 | 65 | 69 | 70 | |
| New registrations of passenger cars | |||||||||||||||||||||||||||||||||||||
| thousands | 2019 | 2.6.6 | 178 | 329 | 550 | 35 | 12 | 250 | 3,607 | 226 | 27 | 114 | 1,258 | 114 | 2,214 | 63 | 158 | 117 | 1,916 | 46 | 55 | 18 | 8 | 446 | 556 | 224 | 162 | 356 | 73 | 102 | 2,311 | 15,348 | 13,839 | 178 | 2,023 | 2,057 | |
| per 1,000 pop'n | 2019 | calc'd | 33 | 37 | 48 | 5 | 14 | 23 | 43 | 39 | 20 | 11 | 27 | 21 | 33 | 15 | 16 | 24 | 32 | 17 | 90 | 9 | 16 | 26 | 15 | 22 | 8 | 35 | 35 | 19 | 35 | 30 | 34 | 33 | 31 | 31 | |
| Passenger transport & | |||||||||||||||||||||||||||||||||||||
| Distance travelled (kilometres per person per year) | |||||||||||||||||||||||||||||||||||||
| Passenger cars | 2018 | 2.3.4 * & | 8,557 | 8,903 | 9,415 | 8,120 | 7,868 | 7,349 | 11,115 | 10,505 | 10,113 | 9,626 | 7,299 | 12,117 | 11,312 | 6,234 | 6,540 | 11,834 | 11,952 | 10,723 | 13,013 | 7,887 | 5,617 | 8,422 | 5,593 | 9,276 | 5,315 | 11,462 | 13,312 | 5,229 | 10,151 | 9,595 | 10,409 | 8,557 | 8,684 | ||
| Powered two-wheelers | 2002 | prev. ** | 55 | 198 | 100 | n/a | n/a | n/a | 217 | 144 | n/a | 2,013 | 334 | 171 | 201 | n/a | n/a | 93 | 1,188 | n/a | 130 | n/a | n/a | 55 | n/a | 754 | n/a | 111 | n/a | n/a | 85 | n/a | 405 | 55 | 58 | ||
| Buses and coaches | 2018 | 2.3.5 * & | 651 | 1,163 | 1,186 | 1,402 | 1,834 | 1,708 | 755 | 1,230 | 2,113 | 1,913 | 690 | 1,451 | 860 | 936 | 1,930 | 2,174 | 1,702 | 1,011 | 1,944 | 1,115 | 1,194 | 306 | 910 | 770 | 1,021 | 987 | 1,815 | 1,146 | 555 | 998 | 946 | 651 | 565 | ||
| Tram / metro | 2018 | 2.3.6 * & | 0 | 815 | 94 | 154 | 0 | 1,012 | 213 | 61 | 104 | 711 | 187 | 129 | 161 | 140 | 277 | 66 | 114 | 0 | 319 | 66 | 0 | 61 | 30 | 114 | 0 | 270 | 0 | 52 | 212 | 190 | 197 | 0 | 117 | ||
| Railways (excl. t/m) | 2018 | 2.3.7 * & | 778 | 1,497 | 940 | 209 | 0 | 963 | 1,185 | 1,072 | 316 | 103 | 609 | 823 | 1,451 | 182 | 795 | 472 | 917 | 126 | 736 | 323 | 0 | 1,100 | 554 | 444 | 286 | 1,339 | 275 | 697 | 1,052 | 477 | 424 | 778 | 779 | ||
| Cycling | 2001 | prev. ** | 56 | 136 | 322 | n/a | n/a | n/a | 291 | 936 | n/a | 76 | 20 | 251 | 75 | n/a | n/a | 184 | 154 | n/a | 23 | n/a | n/a | 848 | n/a | 29 | n/a | 271 | n/a | n/a | 75 | n/a | 186 | 56 | 67 | ||
| Walking | 2001 | prev. ** | 288 | 419 | 380 | n/a | n/a | n/a | 372 | 431 | n/a | 389 | 368 | 386 | 404 | n/a | n/a | 368 | 410 | n/a | 457 | n/a | n/a | 377 | n/a | 342 | n/a | 383 | n/a | n/a | 355 | n/a | 382 | 288 | 286 | ||
| Total these modes | calc'd | 10,385 | 13,131 | 12,437 | 9,886 | 9,702 | 11,032 | 14,147 | 14,378 | 12,646 | 14,832 | 9,507 | 15,328 | 14,465 | 7,492 | 9,541 | 15,190 | 16,437 | 11,859 | 16,622 | 9,389 | 6,811 | 11,169 | 7,087 | 11,730 | 6,621 | 14,822 | 15,402 | 7,123 | 12,484 | 11,260 | 12,949 | 10,385 | 10,557 | |||
| Modal shares &(% of total pass-kms for specified modes) | |||||||||||||||||||||||||||||||||||||
| Passenger cars | 2018 | As distance travelled | 2.3.3 (^) | 85.7 | 8.0 | 75.4 | 89.6 | 94.2 | 59.4 | 30.4 | 33.2 | 99.6 | 36.4 | 59.9 | 67.6 | 67.3 | 92.8 | 50.7 | 82.3 | 82.1 | 94.7 | 99.8 | 95.7 | 93.2 | 37.7 | 70.7 | 94.0 | 73.6 | 52.0 | 96.0 | 91.8 | 84.8 | 81.8 | 86.9 | 85.7 | 85.6 | |
| Bus and coach | 2018 | 2.3.3 | 6.5 | 30.8 | 13.0 | 8.3 | 5.8 | 18.8 | 24.4 | 34.7 | 0.3 | 56.0 | 18.6 | 19.7 | 11.4 | 5.3 | 31.7 | 14.2 | 11.2 | 4.7 | 0.2 | 3.2 | 6.8 | 13.0 | 16.9 | 3.5 | 15.4 | 18.2 | 3.5 | 4.9 | 4.6 | 8.5 | 7.9 | 6.5 | 5.6 | ||
| Railways (excl. t/m) | 2018 | 2.3.3 | 7.8 | 39.6 | 10.3 | 1.2 | - | 10.6 | 38.3 | 30.3 | 0.0 | 3.0 | 16.5 | 11.1 | 19.2 | 1.0 | 13.1 | 3.1 | 6.0 | 0.6 | 0.1 | 0.9 | - | 46.7 | 10.3 | 2.0 | 4.3 | 24.8 | 0.5 | 3.0 | 8.8 | 7.9 | 3.5 | 7.8 | 7.7 | ||
| Tram / metro | 2018 | 2.3.3 | 0.0 | 21.6 | 1.3 | 0.9 | - | 11.1 | 6.9 | 1.7 | 0.0 | 4.6 | 5.1 | 1.6 | 2.1 | 0.8 | 4.6 | 0.4 | 0.7 | - | 0.0 | 0.2 | - | 2.6 | 2.1 | 0.5 | 6.7 | 5.0 | - | 0.2 | 1.8 | 1.7 | 1.6 | 0.0 | 1.2 | ||
| Total pass km these modes | 2018 | calc'd | 9,986 | 12,378 | 11,635 | 9,886 | 9,702 | 11,032 | 13,267 | 12,867 | 12,646 | 12,353 | 8,785 | 14,520 | 13,784 | 7,492 | 9,541 | 14,545 | 14,685 | 11,859 | 15,693 | 9,389 | 6,811 | 9,888 | 7,087 | 10,605 | 6,621 | 14,058 | 15,402 | 7,123 | 11,969 | 11,260 | 11,977 | 9,986 | 10,145 | ||
| International air passenger traffic between EU countries (arrivals plus departures) | |||||||||||||||||||||||||||||||||||||
| million | 2017 | 2.4.1*** | 12.65 | 20.09 | 24.52 | 8.79 | 6.81 | 11.45 | 141.73 | 24.68 | 2.12 | 41.66 | 179.92 | 15.24 | 99.60 | 7.40 | 10.61 | 28.80 | 116.81 | 4.00 | 3.22 | 4.42 | 5.50 | 48.37 | 30.25 | 39.11 | 15.71 | 31.34 | 1.82 | 1.01 | 188.61 | 1113.56 | 1,003.69 | 12.65 | 164.24 | ||
| per head of pop'n | 2017 | calc'd | 2.38 | 2.27 | 2.14 | 1.26 | 7.78 | 1.08 | 1.71 | 4.25 | 1.60 | 3.88 | 3.83 | 2.76 | 1.49 | 1.82 | 1.09 | 5.87 | 1.94 | 1.43 | 5.24 | 2.30 | 11.13 | 2.80 | 0.80 | 3.81 | 0.81 | 3.06 | 0.87 | 0.19 | 2.83 | 2.17 | 2.45 | 2.37 | 2.47 | ||
| Road fatalities | |||||||||||||||||||||||||||||||||||||
| number | 2018 | 2.7.1 | 161 | 409 | 604 | 610 | 49 | 656 | 3,275 | 171 | 67 | 700 | 1,806 | 239 | 3,246 | 317 | 633 | 141 | 3,334 | 173 | 36 | 150 | 18 | 598 | 2,900 | 700 | 1,867 | 324 | 91 | 260 | 1,839 | 25,213 | 17,422 | 161 | 1,785 | 1,840 | |
| per million pop'n | 2018 | calc'd | 30 | 46 | 53 | 87 | 56 | 62 | 39 | 29 | 51 | 65 | 38 | 43 | 48 | 78 | 65 | 29 | 55 | 62 | 59 | 78 | 36 | 35 | 76 | 68 | 96 | 32 | 44 | 48 | 28 | 49 | 43 | 30 | 28 | 28 | |
| Freight transport: modal shares (Thousand million tonne-kms) | |||||||||||||||||||||||||||||||||||||
| Road | 2018 | 2.2.4c | 14.6 | 25.8 | 32.7 | 27.0 | 0.9 | 41.1 | 316.8 | 15.0 | 5.8 | 29.3 | 239.0 | 28.3 | 173.3 | 12.6 | 37.9 | 11.6 | 124.9 | 43.6 | 6.8 | 15.0 | 0.3 | 68.9 | 315.9 | 33.0 | 58.8 | 43.5 | 22.2 | 35.6 | 159.1 | 1,925 | 1,308 | 14.6 | 152.2 | ||
| Rail | 2018 | 2.2.5 | 2.6 | 22.0 | 7.3 | 3.8 | - | 16.6 | 124.6 | 2.6 | 2.6 | 0.4 | 10.7 | 11.2 | 32.0 | 2.7 | 10.6 | 0.1 | 22.1 | 16.9 | 0.2 | 17.9 | - | 7.0 | 59.4 | 2.8 | 13.1 | 23.4 | 5.2 | 8.4 | 17.2 | 441 | 283 | 2.6 | 17.2 | ||
| Inland waterway | 2018 | 2.2.6 | 0.3 | 1.5 | 11 | 4.9 | - | 0 | 47 | - | - | - | - | 0.8 | 7.3 | 0.678 | 1.6 | - | 0.1 | - | 0 | - | - | 47 | 0.1 | - | 12.3 | 0 | - | 0.8 | 0.1 | 136 | 115 | 0.3 | 0.1 | ||
| Pipeline | 2018 | 2.2.7 | 5.8 | 8.6 | 1.0 | 0.7 | - | 2.1 | 17.2 | 2.0 | - | 0.0 | 9.9 | - | 12.4 | 2.0 | 2.5 | - | 10.3 | 0.3 | - | 1.1 | - | 5.5 | 21.3 | 0.4 | 1.1 | - | - | 4.8 | 10.0 | 113 | 78 | 5.8 | 4.8 | ||
| Total these modes | 2018 | calc'd | 23.3 | 57.8 | 52.3 | 36.3 | 1 | 59.8 | 505.5 | 19.6 | 8 | 29.7 | 259.6 | 40 | 225.1 | 18.0 | 52.6 | 12 | 157.4 | 60.8 | 7 | 34.0 | 0 | 128.7 | 396.7 | 36.2 | 85.2 | 67 | 27 | 49.5 | 186.4 | 2,614 | 1,784 | 23.3 | 174.3 | ||
| Freight transport: modal shares (% of total tonne-kms) | |||||||||||||||||||||||||||||||||||||
| Road | 2018 | 2.2.4c * | 62.7 | 44.6 | 62.5 | 74.2 | 100.0 | 68.7 | 62.7 | 76.6 | 69.1 | 98.5 | 92.1 | 70.2 | 77.0 | 70.0 | 72.1 | 99.2 | 79.4 | 71.7 | 94.1 | 44.2 | 100.0 | 53.5 | 79.6 | 91.1 | 69.0 | 65.0 | 81.2 | 71.9 | 85.4 | 73.6 | 73.3 | 62.7 | 87.3 | ||
| Rail | 2018 | 2.2.5 * | 11.2 | 38.0 | 13.9 | 10.5 | - | 27.7 | 24.7 | 13.2 | 30.9 | 1.4 | 4.1 | 27.7 | 14.2 | 15.2 | 20.1 | 0.8 | 14.0 | 27.8 | 3.1 | 52.6 | - | 5.5 | 15.0 | 7.6 | 15.4 | 34.9 | 18.8 | 16.9 | 9.2 | 16.9 | 15.9 | 11.2 | 9.9 | ||
| Inland waterway | 2018 | 2.2.6 * | 1.1 | 2.6 | 21.7 | 13.4 | - | 0.0 | 9.3 | - | - | - | - | 2.1 | 3.2 | 3.8 | 3.1 | - | 0.0 | - | 2.8 | - | - | 36.7 | 0.0 | - | 14.4 | 0.0 | - | 1.6 | 0.0 | 5.2 | 6.5 | 1.1 | 0.1 | ||
| Pipeline | 2018 | 2.2.7 * | 25.0 | 14.8 | 1.9 | 1.8 | - | 3.5 | 3.4 | 10.2 | - | 0.1 | 3.8 | - | 5.5 | 11.0 | 4.7 | - | 6.6 | 0.5 | - | 3.3 | - | 4.3 | 5.4 | 1.2 | 1.3 | - | - | 9.7 | 5.3 | 4.3 | 4.3 | 25.0 | 2.7 | ||
( # ) These are the nearest available figures for Scotland, and comparable figures for GB or UK as a whole - information on sources is given in the text. These may be on a different basis from other countries.
( + ) All roads data relates to the end of 2005, except for motorway estimate.
( @ ) The definitions of road types vary from country to country. Some countries' figures may include the lengths of some roads which do not have a hard surface.
( $ ) The notes on the sources of the statistics explain why there appears to be a large inconsistency between the EU publication's figure for the UK and the (DfT) figure for GB.
(^) UK figure is for GB only.
( * ) Calculated from the figures in that table, which gives the total number of passenger/tonne-kilometres for the country as a whole (in 100/1000 millions).
(&) National Travel Survey data is only collected for England now. Figures for Scotland and GB are for the last time they were available in 2012.
( ** ) As shown in (or as calculated from figures in) a previous edition - the 2012 edition does not provide any figures for powered two-wheelers, cycling or walking.
( *** ) Data calculated by adding together the total number of journeys across each row in Table 2.4.1
n/a or 0 In general, n/a is used where a figure is not available, and 0 is used where a figure is nil. However, n/a may be treated as if it were 0 for the purpose of some calculations.