Public transport
Public transport
Local bus services
29% of survey respondents had used the bus in the past month. 3% used the bus every day or almost every day. [Table SUM1, Table 28a]
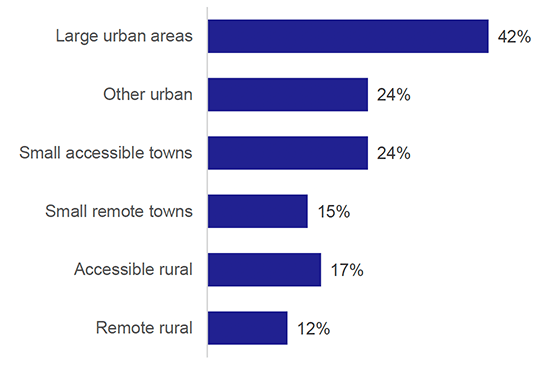
Frequency of bus use was also higher in urban areas: 42% of people in large urban areas used the bus at least once a month compared to 12% in remote rural areas. [Table 28a and Figure 15]
Rail travel
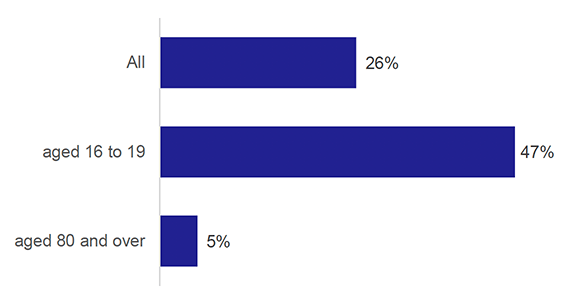
26% of the population had used the train in the last month. [Table 28b, Table SUM1]
The proportion of people who reported that they had used the train in the last month decreased with age: 47% of those aged 16-19 had used the train in the last month, compared to 11% aged 70 to 79 and 5% of those aged 80 and over. [Table 28b and Figure 16]
Of those who had used the train in the last month, the most frequent journey purpose was visiting friends or relatives (32%), followed by shopping (28%). [Table 44]
Public transport cost
The average amount spent by an adult on public transport was £2.20 per week. Most people (84%) spent nothing. This includes those who do not use public transport and holders of a pass for free travel. [Table 53]
For those who said they used public transport at least once a week, the average spent was £7.50 per week and 52% spent nothing (this will include free pass holders). [Table 53]
Excluding free travel pass holders who are over 60 or have a long-term health problem or illness, the average cost for those travelling about once a week or more was £10.70. 34% of these spent nothing, 36% up to £10, 11% between £10 and £20, and 19% over £20. [Table 53]
Free bus travel for people under 22 was introduced towards the end of the survey period, although uptake was initially low.
Affordability of transport
78% of people said their transport costs were either fairly easy or very easy to afford. Those in households on incomes up to £10,000 were less likely to consider their costs affordable (61%). The survey was conducted over a time period before fuel prices and general inflation reached a peak in 2022. [Table 54 and Figure 17]

41% said transport costs affected the method of travel they used. This rose to 53% for those earning £10,000 or less. [Table 55]